Nike 2013 Annual Report Download - page 25
Download and view the complete annual report
Please find page 25 of the 2013 Nike annual report below. You can navigate through the pages in the report by either clicking on the pages listed below, or by using the keyword search tool below to find specific information within the annual report.-
 1
1 -
2
-
3
-
4
-
5
-
6
-
7
-
8
-
9
-
10
-
11
-
12
-
13
-
14
-
 15
15 -
 16
16 -
 17
17 -
 18
18 -
 19
19 -
 20
20 -
 21
21 -
 22
22 -
 23
23 -
 24
24 -
 25
25 -
 26
26 -
 27
27 -
 28
28 -
 29
29 -
 30
30 -
 31
31 -
 32
32 -
 33
33 -
 34
34 -
 35
35 -
36
-
37
-
38
-
39
-
40
-
41
-
42
-
43
-
44
-
45
-
46
-
47
-
48
-
49
-
50
-
51
-
52
-
53
-
54
-
55
-
56
-
57
-
58
-
59
-
60
-
61
-
62
-
63
-
64
-
65
-
66
-
67
-
68
-
69
-
70
-
71
-
72
-
73
-
74
-
75
-
76
-
77
-
78
-
79
-
80
-
81
-
82
-
83
-
84
 |
 |

PART II
Other (income) expense, net is comprised of foreign currency conversion
gains and losses from the re-measurement of monetary assets and liabilities
denominated in non-functional currencies, the impact of certain foreign
currency derivative instruments, as well as unusual or non-operating
transactions that are outside the normal course of business.
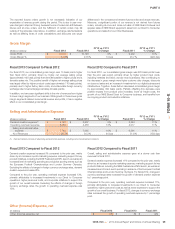
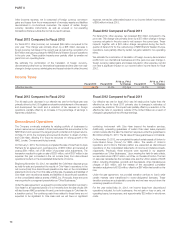
Fiscal 2013 Compared to Fiscal 2012
For fiscal 2013, other (income), net increased $69 million compared to the
prior year. This change was primarily driven by a $48 million decrease in
foreign currency net losses in the current year as well as the recognition of a
$24 million restructuring charge for NIKE Brand’s Western Europe operations
in the prior year. These positive impacts were partially offset by smaller net
gains from non-operating items.
We estimate the combination of the translation of foreign currency-
denominated profits from our international businesses and the year-over-year
change in foreign currency related gains and losses included in other (income)
expense, net had an unfavorable impact on our income before income taxes
of $56 million for fiscal 2013.
Fiscal 2012 Compared to Fiscal 2011
For fiscal 2012, other expense, net increased $79 million compared to the
prior year. This change was primarily driven by a $77 million change in foreign
currency net gains in the prior year to net losses in the current year. These
impacts, together with a $24 million charge recognized during the fourth
quarter of fiscal 2012 for the restructuring of NIKE Brand’s Western Europe
operations, were partially offset by certain net gains related to non-operating
items.
We estimate the combination of translation of foreign currency-denominated
profits from our international businesses and the year-over-year change in
foreign currency related gains and losses included in other expense, net did
not have a significant impact on our income before income taxes for fiscal
2012.
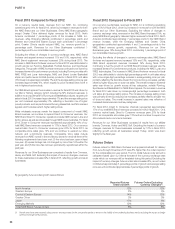
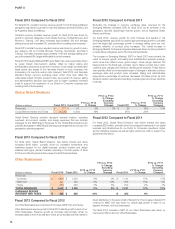
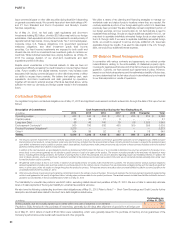
Income Taxes
Fiscal 2013 Fiscal 2012
FY13 vs. FY12
% Change Fiscal 2011
FY12 vs. FY11
% Change
Effective tax rate 24.7% 25.0% (30) bps 24.1% 90 bps
Fiscal 2013 Compared to Fiscal 2012
The 30 basis point decrease in our effective tax rate for the fiscal year was
primarily driven by the U.S. legislative retroactive reinstatement of the research
and development tax credit and a reduction of tax reserves on foreign
operations, partially offset by an increase in the percentage of earnings in
higher tax jurisdictions.
Fiscal 2012 Compared to Fiscal 2011
Our effective tax rate for fiscal 2012 was 90 basis points higher than the
effective tax rate for fiscal 2011 primarily due to changes in estimates of
uncertain tax positions. This impact was partially offset by a reduction in the
effective tax rate on operations outside of the United States as a result of
changes in geographical mix of foreign earnings.
Discontinued Operations
The Company continually evaluates its existing portfolio of businesses to
ensure resources are invested in those businesses that are accretive to the
NIKE Brand and represent the largest growth potential and highest returns.
On May 31, 2012, the Company announced its intention to divest of Umbro
and Cole Haan, allowing it to focus its resources on driving growth in the
NIKE, Jordan, Converse and Hurley brands.
On February 1, 2013, the Company completed the sale of Cole Haan to Apax
Partners for an agreed upon purchase price of $570 million and received at
closing $561 million, net of $9 million of purchase price adjustments. The
transaction resulted in a gain on sale of $231 million, net of $137 million in tax
expense; this gain is included in the net income (loss) from discontinued
operations line item on the consolidated statements of income.
Beginning November 30, 2012, we classified the Cole Haan disposal group
as held-for-sale and presented the results of Cole Haan’s operations in the
net income (loss) from discontinued operations line item on the consolidated
statements of income. From this date until the sale, the assets and liabilities of
Cole Haan were recorded as assets and liabilities of discontinued operations
on the consolidated balance sheets of NIKE, Inc. Previously, these amounts
were reported in our segment presentation as “Other Businesses.”
Under the sale agreement, we agreed to provide certain transition services to
Cole Haan for an expected period of 3 to 9 months from the date of sale. We
will also license NIKE proprietary Air and Lunar technologies to Cole Haan for
a transition period. The continuing cash flows related to these items are not
expected to be significant to Cole Haan and we will have no significant
continuing involvement with Cole Haan beyond the transition services.
Additionally, preexisting guarantees of certain Cole Haan lease payments
remain in place after the sale; the maximum exposure under the guarantees is
$44 million at May 31, 2013. The fair value of these guarantees is not material.
On November 30, 2012, we completed the sale of certain assets of Umbro to
Iconix Brand Group (“Iconix”) for $225 million. The results of Umbro’s
operations and Umbro’s financial position are presented as discontinued
operations on the consolidated statements of income and balance sheets,
respectively. Previously, these amounts were reported in our segment
presentation as “Other Businesses.” Upon meeting the held-for-sale criteria,
we recorded a loss of $107 million, net of tax, on the sale of Umbro. The loss
on sale was calculated as the net sales price less the Umbro assets of $248
million, including intangibles, goodwill, and fixed assets, other miscellaneous
charges of $22 million, and the release of the associated cumulative
translation adjustment of $129 million, offset by a $67 million tax benefit on the
loss.
Under the sale agreement, we provided transition services to Iconix while
certain markets were transitioned to Iconix-designated licensees. These
transition services are substantially complete and we have wound down the
remaining operations of Umbro.
For the year ended May 31, 2013, net income (loss) from discontinued
operations included, for both businesses, the net gain or loss on sale, net
operating losses, tax expenses, and approximately $20 million in wind down
costs.
70