Nike 2013 Annual Report Download - page 18
Download and view the complete annual report
Please find page 18 of the 2013 Nike annual report below. You can navigate through the pages in the report by either clicking on the pages listed below, or by using the keyword search tool below to find specific information within the annual report.-
 1
1 -
2
-
3
-
4
-
5
-
6
-
7
-
 8
8 -
 9
9 -
 10
10 -
 11
11 -
 12
12 -
 13
13 -
 14
14 -
 15
15 -
 16
16 -
 17
17 -
 18
18 -
 19
19 -
 20
20 -
 21
21 -
 22
22 -
 23
23 -
 24
24 -
 25
25 -
 26
26 -
 27
27 -
 28
28 -
29
-
30
-
31
-
32
-
33
-
34
-
35
-
36
-
37
-
38
-
39
-
40
-
41
-
42
-
43
-
44
-
45
-
46
-
47
-
48
-
49
-
50
-
51
-
52
-
53
-
54
-
55
-
56
-
57
-
58
-
59
-
60
-
61
-
62
-
63
-
64
-
65
-
66
-
67
-
68
-
69
-
70
-
71
-
72
-
73
-
74
-
75
-
76
-
77
-
78
-
79
-
80
-
81
-
82
-
83
-
84
 |
 |
PART II
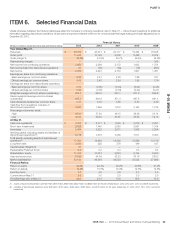
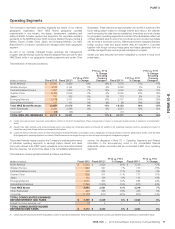
ITEM 6. Selected Financial Data
Unless otherwise indicated, the following disclosures reflect the Company’s continuing operations; refer to Note 15 — Discontinued Operations for additional
information regarding discontinued operations. All per share amounts are reflective of the two-for-one stock split that began trading at the split-adjusted price on
December 26, 2012.
(Dollars in millions, except per share data and financial ratios)
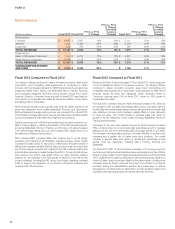
Financial History
2013 2012 2011 2010 2009
Year Ended May 31,
Revenues $ 25,313 $ 23,331 $ 20,117 $ 18,324 $ 18,528
Gross profit 11,034 10,148 9,202 8,498 8,324
Gross margin % 43.6% 43.5% 45.7% 46.4% 44.9%
Restructuring charges — — — — 195
Net income from continuing operations 2,464 2,269 2,172 1,923 1,754
Net income (loss) from discontinued operations 21 (46) (39) (16) (267)
Net income 2,485 2,223 2,133 1,907 1,487
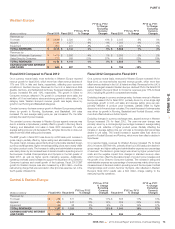
Earnings per share from continuing operations:
Basic earnings per common share 2.75 2.47 2.28 1.98 1.81
Diluted earnings per common share 2.69 2.42 2.24 1.95 1.79
Earnings per share from discontinued operations:
Basic earnings per common share 0.02 (0.05) (0.04) (0.02) (0.28)
Diluted earnings per common share 0.02 (0.05) (0.04) (0.02) (0.27)
Weighted average common shares outstanding 897.3 920.0 951.1 971.0 969.8
Diluted weighted average common shares
outstanding 916.4 939.6 971.3 987.8 981.4
Cash dividends declared per common share 0.81 0.70 0.60 0.53 0.49
Cash flow from operations, inclusive of
discontinued operations 3,027 1,899 1,812 3,164 1,736
Price range of common stock:
High 65.91 57.20 46.15 39.28 35.14
Low 43.89 39.29 33.61 25.08 19.12
At May 31,
Cash and equivalents $ 3,337 $ 2,317 $ 1,955 $ 3,079 $ 2,291
Short-term investments 2,628 1,440 2,583 2,067 1,164
Inventories 3,434 3,222 2,611 1,942 2,254
Working capital, excluding assets and liabilities of
discontinued operations(1)(2) 9,718 7,518 7,266 7,511 6,390
Total assets, excluding assets of discontinued
operations(1) 17,584 14,850 14,438 13,889 12,716
Long-term debt 1,210 228 276 446 437
Capital Lease Obligations 81 — — — —
Redeemable Preferred Stock 0.3 0.3 0.3 0.3 0.3
Shareholders’ equity 11,156 10,381 9,843 9,754 8,693
Year-end stock price 61.66 54.09 42.23 36.19 28.53
Market capitalization 55,124 49,546 39,523 35,032 27,698
Financial Ratios:
Return on equity 22.9% 22.4% 22.2% 20.8% 21.2%
Return on assets 15.2% 15.5% 15.3% 14.5% 14.6%
Inventory turns 4.3 4.5 4.8 4.7 4.5
Current ratio at May 31 3.5 3.0 2.9 3.3 3.0
Price/Earnings ratio at May 31 22.9 22.4 18.9 18.6 15.9
(1) Assets of discontinued operations were $0 million, $615 million, $560 million, $530 million, and $534 million for the years ended May 31, 2013, 2012, 2011, 2010, and 2009, respectively.
(2) Liabilities of discontinued operations were $18 million, $170 million, $184 million, $182 million, and $176 million for the years ended May 31, 2013, 2012, 2011, 2010, and 2009,
respectively.
NIKE, INC. 2013 Annual Report and Notice of Annual Meeting 63
FORM 10-K