Nike 2013 Annual Report Download - page 63
Download and view the complete annual report
Please find page 63 of the 2013 Nike annual report below. You can navigate through the pages in the report by either clicking on the pages listed below, or by using the keyword search tool below to find specific information within the annual report.-
 1
1 -
2
-
3
-
4
-
5
-
6
-
7
-
8
-
9
-
10
-
11
-
12
-
13
-
14
-
15
-
16
-
17
-
18
-
19
-
20
-
21
-
22
-
23
-
24
-
25
-
26
-
27
-
28
-
29
-
30
-
31
-
32
-
33
-
34
-
35
-
36
-
37
-
38
-
39
-
40
-
41
-
42
-
43
-
44
-
45
-
46
-
47
-
48
-
49
-
50
-
51
-
52
-
 53
53 -
 54
54 -
 55
55 -
 56
56 -
 57
57 -
 58
58 -
 59
59 -
 60
60 -
 61
61 -
 62
62 -
 63
63 -
 64
64 -
 65
65 -
 66
66 -
 67
67 -
 68
68 -
 69
69 -
 70
70 -
 71
71 -
 72
72 -
 73
73 -
74
-
75
-
76
-
77
-
78
-
79
-
80
-
81
-
82
-
83
-
84
 |
 |
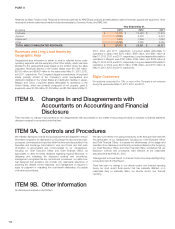
PART II
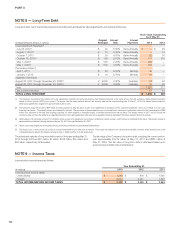
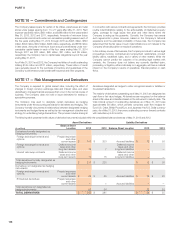
NOTE 16 — Commitments and Contingencies
The Company leases space for certain of its offices, warehouses and retail
stores under leases expiring from 1 to 21 years after May 31, 2013. Rent
expense was $482 million, $431 million, and $386 million for the years ended
May 31, 2013, 2012 and 2011, respectively. Amounts of minimum future
annual rental commitments under non-cancelable operating leases in each of
the five years ending May 31, 2014 through 2018 are $403 million, $340
million, $304 million, $272 million, $225 million, respectively, and $816 million
in later years. Amounts of minimum future annual commitments under non-
cancelable capital leases in each of the four years ending May 31, 2014
through 2017 are $23 million, $28 million, $21 million, and $9 million,
respectively; the Company has no capital lease obligations beyond the year
ending May 31, 2017.
As of May 31, 2013 and 2012, the Company had letters of credit outstanding
totaling $149 million and $137 million, respectively. These letters of credit
were generally issued for the purchase of inventory and guarantees of the
Company’s performance under certain self-insurance and other programs.
In connection with various contracts and agreements, the Company provides
routine indemnifications relating to the enforceability of intellectual property
rights, coverage for legal issues that arise and other items where the
Company is acting as the guarantor. Currently, the Company has several
such agreements in place. However, based on the Company’s historical
experience and the estimated probability of future loss, the Company has
determined that the fair value of such indemnifications is not material to the
Company’s financial position or results of operations.
In the ordinary course of its business, the Company is involved in various legal
proceedings involving contractual and employment relationships, product
liability claims, trademark rights, and a variety of other matters. While the
Company cannot predict the outcome of its pending legal matters with
certainty, the Company does not believe any currently identified claim,
proceeding or litigation, either individually or in aggregate, will have a material
impact on the Company’s results of operations, financial position or cash
flows.
NOTE 17 — Risk Management and Derivatives
The Company is exposed to global market risks, including the effect of
changes in foreign currency exchange rates and interest rates, and uses
derivatives to manage financial exposures that occur in the normal course of
business. The Company does not hold or issue derivatives for trading or
speculative purposes.
The Company may elect to designate certain derivatives as hedging
instruments under the accounting standards for derivatives and hedging. The
Company formally documents all relationships between designated hedging
instruments and hedged items as well as its risk management objective and
strategy for undertaking hedge transactions. This process includes linking all
derivatives designated as hedges to either recognized assets or liabilities or
forecasted transactions.
The majority of derivatives outstanding as of May 31, 2013 are designated as
cash flow or fair value hedges. All derivatives are recognized on the balance
sheet at fair value and classified based on the instrument’s maturity date. The
total notional amount of outstanding derivatives as of May 31, 2013 was
approximately $9 billion, which primarily comprises cash flow hedges for
Euro/U.S. Dollar, British Pound/Euro, and Japanese Yen/U.S. Dollar currency
pairs. As of May 31, 2013, there were outstanding currency forward contracts
with maturities up to 24 months.
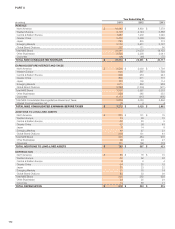
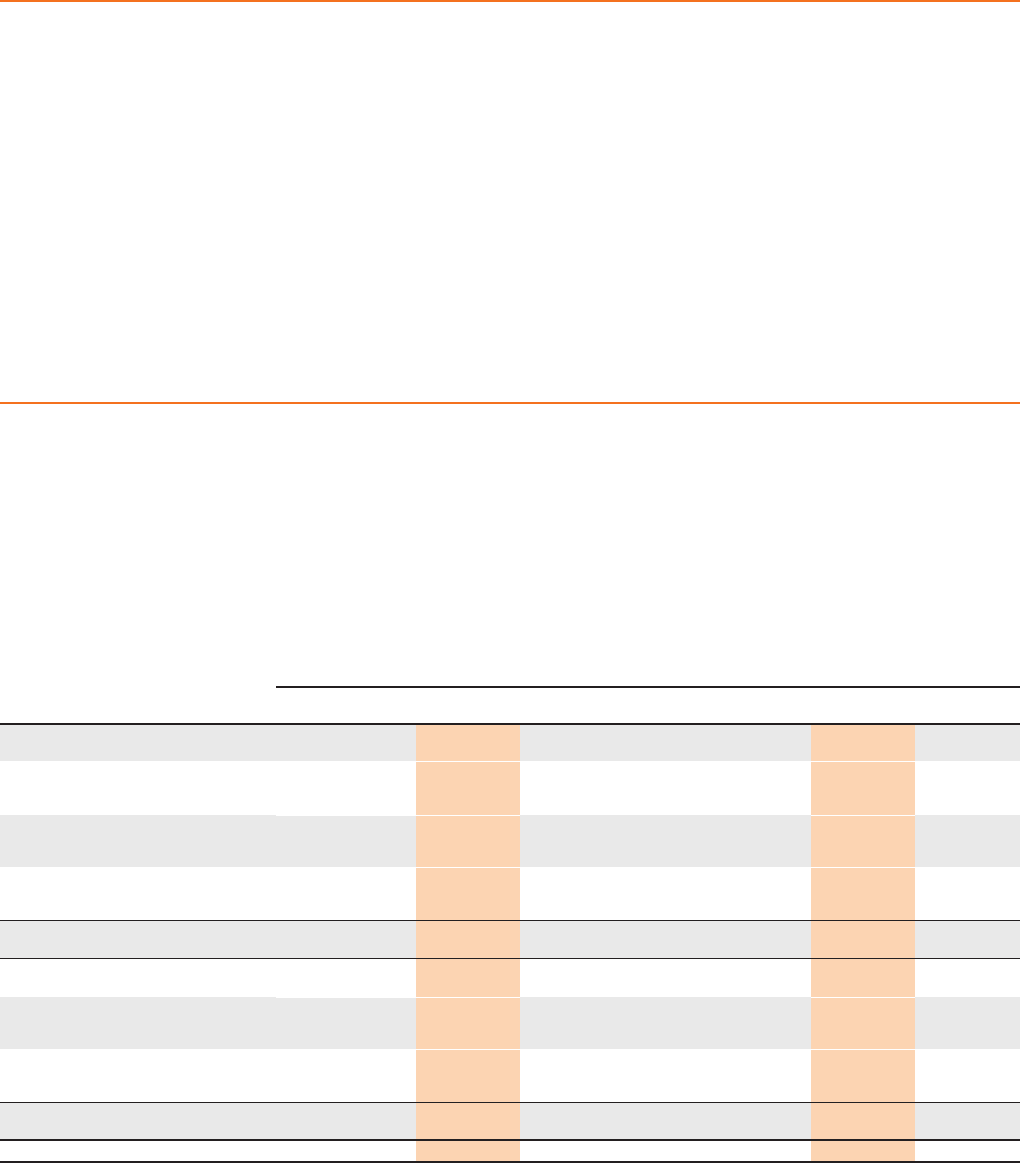
The following table presents the fair values of derivative instruments included within the consolidated balance sheets as of May 31, 2013 and 2012:
Asset Derivatives Liability Derivatives
(In millions)
Balance Sheet
Location 2013 2012 Balance Sheet Location 2013 2012
Derivatives formally designated as
hedging instruments:
Foreign exchange forwards and
options Prepaid expenses
and other
current assets $ 141 $ 203 Accrued liabilities $ 12 $ 35
Foreign exchange forwards and
options Deferred income
taxes and other
long-term assets 79 7
Deferred income
taxes and other
long-term liabilities — —
Interest rate swap contracts Deferred income
taxes and other
long-term assets 11 15
Deferred income
taxes and other
long-term liabilities — —
Total derivatives formally designated as
hedging instruments $ 231 $ 225 $ 12 $ 35
Derivatives not designated as hedging
instruments:
Foreign exchange forwards and
options Prepaid expenses
and other
current assets $ 58 $ 55 Accrued liabilities $ 22 $ 20
Embedded derivatives Prepaid expenses
and other
current assets — 1 Accrued liabilities — —
Total derivatives not designated as
hedging instruments 58 56 22 20
TOTAL DERIVATIVES $ 289 $ 281 $ 34 $ 55
108