Nike 2013 Annual Report Download - page 58
Download and view the complete annual report
Please find page 58 of the 2013 Nike annual report below. You can navigate through the pages in the report by either clicking on the pages listed below, or by using the keyword search tool below to find specific information within the annual report.-
 1
1 -
2
-
3
-
4
-
5
-
6
-
7
-
8
-
9
-
10
-
11
-
12
-
13
-
14
-
15
-
16
-
17
-
18
-
19
-
20
-
21
-
22
-
23
-
24
-
25
-
26
-
27
-
28
-
29
-
30
-
31
-
32
-
33
-
34
-
35
-
36
-
37
-
38
-
39
-
40
-
41
-
42
-
43
-
44
-
45
-
46
-
47
-
 48
48 -
 49
49 -
 50
50 -
 51
51 -
 52
52 -
 53
53 -
 54
54 -
 55
55 -
 56
56 -
 57
57 -
 58
58 -
 59
59 -
 60
60 -
 61
61 -
 62
62 -
 63
63 -
 64
64 -
 65
65 -
 66
66 -
 67
67 -
 68
68 -
69
-
70
-
71
-
72
-
73
-
74
-
75
-
76
-
77
-
78
-
79
-
80
-
81
-
82
-
83
-
84
 |
 |
PART II
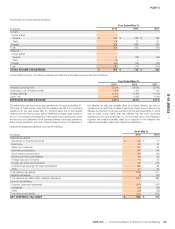
The provision for income taxes is as follows:
Year Ended May 31,
(In millions) 2013 2012 2011
Current:
United States
Federal $ 434 $ 289 $ 298
State 69 51 57
Foreign 398 488 435
Total 901 828 790
Deferred:
United States
Federal 1 (48) (62)
State (4) 5 —
Foreign (90) (29) (38)
Total (93) (72) (100)
TOTAL INCOME TAX EXPENSE $ 808 $ 756 $ 690
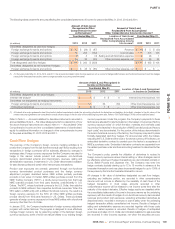
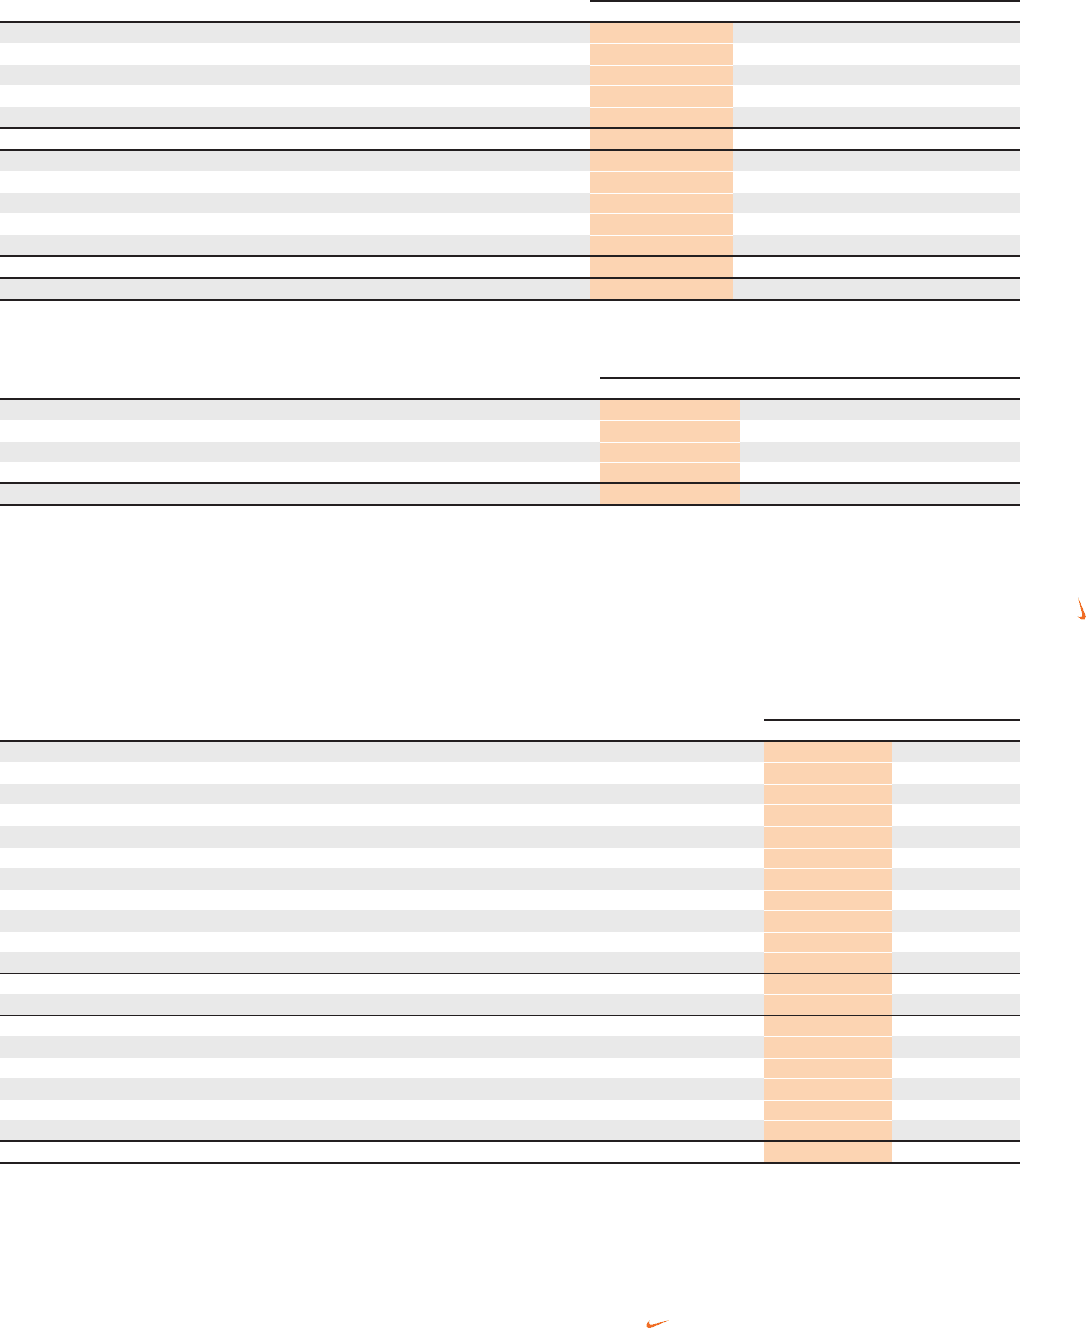
A reconciliation from the U.S. statutory federal income tax rate to the effective income tax rate is as follows:
Year Ended May 31,
2013 2012 2011
Federal income tax rate 35.0% 35.0% 35.0%
State taxes, net of federal benefit 1.4% 1.3% 1.3%
Foreign earnings -11.8% -11.9% -11.4%
Other, net 0.1% 0.6% -0.8%
EFFECTIVE INCOME TAX RATE 24.7% 25.0% 24.1%
The effective tax rate from continuing operations for the year ended May 31,
2013 was 30 basis points lower than the effective tax rate from continuing
operations for the year ended May 31, 2012 primarily due to tax benefits
received from the intercompany sale of intellectual property rights outside of
the U.S., the retroactive reinstatement of the research and development credit
and the intra-period allocation of tax expense between continuing operations,
discontinued operations, and other comprehensive income. The decrease in
the effective tax rate was partially offset by a higher effective tax rate on
operations as a result of an increase in earnings in higher tax jurisdictions. The
effective tax rate from continuing operations for the year ended May 31, 2012
was 90 basis points higher than the effective tax rate from continuing
operations for the year ended May 31, 2011 primarily due to the changes in
uncertain tax positions partially offset by a reduction in the effective rate
related to a decrease in earnings in higher tax jurisdictions.
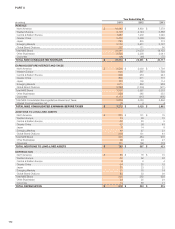
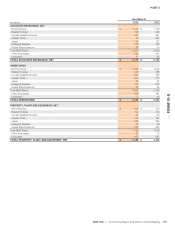
Deferred tax assets and (liabilities) comprise the following:
As of May 31,
(In millions) 2013 2012
Deferred tax assets:
Allowance for doubtful accounts $20$17
Inventories 40 37
Sales return reserves 101 84
Deferred compensation 197 186
Stock-based compensation 140 126
Reserves and accrued liabilities 66 66
Foreign loss carry-forwards 19 35
Foreign tax credit carry-forwards 106 216
Undistributed earnings of foreign subsidiaries 162 82
Other 47 62
Total deferred tax assets 898 911
Valuation allowance (5) (27)
Total deferred tax assets after valuation allowance 893 884
Deferred tax liabilities:
Property, plant and equipment (241) (191)
Intangibles (96) (98)
Other (20) (22)
Total deferred tax liability (357) (311)
NET DEFERRED TAX ASSET $ 536 $ 573
NIKE, INC. 2013 Annual Report and Notice of Annual Meeting 103
FORM 10-K