Nike 2013 Annual Report Download - page 68
Download and view the complete annual report
Please find page 68 of the 2013 Nike annual report below. You can navigate through the pages in the report by either clicking on the pages listed below, or by using the keyword search tool below to find specific information within the annual report.-
 1
1 -
2
-
3
-
4
-
5
-
6
-
7
-
8
-
9
-
10
-
11
-
12
-
13
-
14
-
15
-
16
-
17
-
18
-
19
-
20
-
21
-
22
-
23
-
24
-
25
-
26
-
27
-
28
-
29
-
30
-
31
-
32
-
33
-
34
-
35
-
36
-
37
-
38
-
39
-
40
-
41
-
42
-
43
-
44
-
45
-
46
-
47
-
48
-
49
-
50
-
51
-
52
-
53
-
54
-
55
-
56
-
57
-
 58
58 -
 59
59 -
 60
60 -
 61
61 -
 62
62 -
 63
63 -
 64
64 -
 65
65 -
 66
66 -
 67
67 -
 68
68 -
 69
69 -
 70
70 -
 71
71 -
 72
72 -
 73
73 -
 74
74 -
 75
75 -
 76
76 -
 77
77 -
 78
78 -
79
-
80
-
81
-
82
-
83
-
84
 |
 |
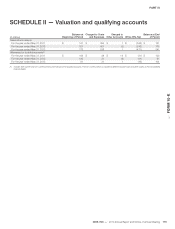
PART II
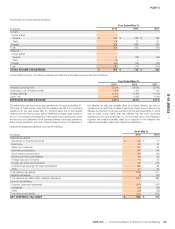
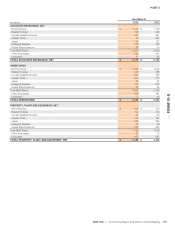
As of May 31,
(In millions) 2013 2012
ACCOUNTS RECEIVABLE, NET
North America $ 1,214 $ 1,149
Western Europe 356 420
Central & Eastern Europe 301 261
Greater China 52 221
Japan 133 152
Emerging Markets 546 476
Global Brand Divisions 28 30
Total NIKE Brand 2,630 2,709
Other Businesses 436 401
Corporate 51 22
TOTAL ACCOUNTS RECEIVABLE, NET $ 3,117 $ 3,132
INVENTORIES
North America $ 1,435 $ 1,272
Western Europe 539 488
Central & Eastern Europe 207 180
Greater China 204 217
Japan 60 83
Emerging Markets 555 521
Global Brand Divisions 32 35
Total NIKE Brand 3,032 2,796
Other Businesses 400 384
Corporate 242
TOTAL INVENTORIES $ 3,434 $ 3,222
PROPERTY, PLANT AND EQUIPMENT, NET
North America $ 406 $ 378
Western Europe 326 314
Central & Eastern Europe 44 30
Greater China 213 191
Japan 269 359
Emerging Markets 89 59
Global Brand Divisions 353 205
Total NIKE Brand 1,700 1,536
Other Businesses 77 76
Corporate 675 597
TOTAL PROPERTY, PLANT AND EQUIPMENT, NET $ 2,452 $ 2,209
NIKE, INC. 2013 Annual Report and Notice of Annual Meeting 113
FORM 10-K