Nike 2013 Annual Report Download - page 24
Download and view the complete annual report
Please find page 24 of the 2013 Nike annual report below. You can navigate through the pages in the report by either clicking on the pages listed below, or by using the keyword search tool below to find specific information within the annual report.-
 1
1 -
2
-
3
-
4
-
5
-
6
-
7
-
8
-
9
-
10
-
11
-
12
-
13
-
 14
14 -
 15
15 -
 16
16 -
 17
17 -
 18
18 -
 19
19 -
 20
20 -
 21
21 -
 22
22 -
 23
23 -
 24
24 -
 25
25 -
 26
26 -
 27
27 -
 28
28 -
 29
29 -
 30
30 -
 31
31 -
 32
32 -
 33
33 -
 34
34 -
35
-
36
-
37
-
38
-
39
-
40
-
41
-
42
-
43
-
44
-
45
-
46
-
47
-
48
-
49
-
50
-
51
-
52
-
53
-
54
-
55
-
56
-
57
-
58
-
59
-
60
-
61
-
62
-
63
-
64
-
65
-
66
-
67
-
68
-
69
-
70
-
71
-
72
-
73
-
74
-
75
-
76
-
77
-
78
-
79
-
80
-
81
-
82
-
83
-
84
 |
 |

PART II
The reported futures orders growth is not necessarily indicative of our
expectation of revenue growth during this period. This is due to year-over-
year changes in shipment timing, because the mix of orders can shift between
futures and at-once orders, and the fulfillment of certain orders may fall
outside of the schedule noted above. In addition, exchange rate fluctuations
as well as differing levels of order cancellations and discounts can cause
differences in the comparisons between futures orders and actual revenues.
Moreover, a significant portion of our revenue is not derived from futures
orders, including at-once and close-out sales of NIKE Brand footwear and
apparel, sales of NIKE Brand equipment, sales from our Direct to Consumer
operations, and sales from our Other Businesses.
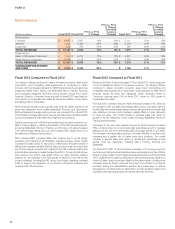
Gross Margin
(Dollars in millions) Fiscal 2013 Fiscal 2012
FY13 vs. FY12
% Change Fiscal 2011
FY12 vs. FY11
% Change
Gross Profit $ 11,034 $ 10,148 9% $ 9,202 10%
Gross Margin % 43.6% 43.5% 10 bps 45.7% (220) bps
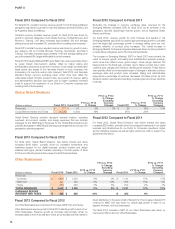
Fiscal 2013 Compared to Fiscal 2012
For fiscal 2013, our consolidated gross margin was 10 basis points higher
than fiscal 2012, primarily driven by higher net average selling prices
(approximately 160 basis points) that were attributable to higher prices and a
favorable sales mix. The positive benefit of higher net average selling prices
was largely offset by higher product costs (approximately 110 basis points),
primarily due to higher factory labor costs, and unfavorable foreign currency
exchange rate movements (approximately 40 basis points).
In addition, we have seen significant shifts in the mix of revenues from higher
to lower margin segments of our business. While growth in these lower gross
margin segments delivers incremental revenue and profits, it has a negative
effect on our consolidated gross margin.
Fiscal 2012 Compared to Fiscal 2011
For fiscal 2012, our consolidated gross margin was 220 basis points lower
than the prior year period, primarily driven by higher product input costs,
including materials and labor, across most businesses. Also contributing to
the decrease in gross margin were higher customs duty charges, discounts
on close-out sales and an increase in investments in our digital business and
infrastructure. Together, these factors decreased consolidated gross margin
by approximately 390 basis points. Partially offsetting this decrease were
positive impacts from product price increases, lower air freight costs, the
growth of our NIKE Brand Direct to Consumer business, and benefits from
our ongoing product cost reduction initiatives.
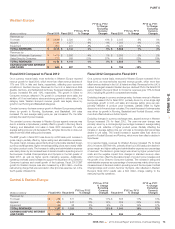
Selling and Administrative Expense
(Dollars in millions) Fiscal 2013 Fiscal 2012
FY13 vs. FY12
% Change Fiscal 2011
FY12 vs. FY11
% Change
Demand creation expense(1) $ 2,745 $ 2,607 5% $ 2,344 11%
Operating overhead expense 5,035 4,458 13% 4,017 11%
Selling and administrative
expense $ 7,780 $ 7,065 10% $ 6,361 11%
% of Revenues 30.7% 30.3% 40 bps 31.6% (130) bps
(1) Demand creation consists of advertising and promotion expenses, including costs of endorsement contracts.
Fiscal 2013 Compared to Fiscal 2012
Demand creation expense increased 5% compared to the prior year, mainly
driven by an increase in sports marketing expense, marketing support for key
product initiatives, including the NIKE Fuelband and NFL launch, as well as an
increased level of marketing spending around global sporting events such as
the European Football Championships and London Summer Olympics.
Excluding the effects of changes in foreign currency exchange rates, demand
creation expense increased 8%.
Compared to the prior year, operating overhead expense increased 13%,
primarily attributable to increased investments in our Direct to Consumer
operations, higher personnel costs, and corporate initiatives to support the
growth of our overall business. Excluding the effects of changes in foreign
currency exchange rates, the growth in operating overhead expense was
15%.
Fiscal 2012 Compared to Fiscal 2011
Overall, selling and administrative expense grew at a slower rate than
revenues for fiscal 2012.
Demand creation expense increased 11% compared to the prior year, mainly
driven by an increase in sports marketing expense, marketing support for key
product initiatives, including the NIKE Fuelband and NFL launch, as well as an
increased level of brand event spending in advance of the European Football
Championships and London Summer Olympics. For fiscal 2012, changes in
currency exchange rates increased the growth of demand creation expense
by 1 percentage point.
Compared to the prior year, operating overhead expense increased 11%,
primarily attributable to increased investments in our Direct to Consumer
operations, higher personnel costs as well as travel expenses to support the
growth of our overall business. For fiscal 2012, changes in currency exchange
rates increased the growth of operating overhead expense by 1 percentage
point.
Other (Income) Expense, net
(In millions) Fiscal 2013 Fiscal 2012 Fiscal 2011
Other (income) expense, net $ (15) $ 54 $ (25)
NIKE, INC. 2013 Annual Report and Notice of Annual Meeting 69
FORM 10-K