Nike 2013 Annual Report Download - page 27
Download and view the complete annual report
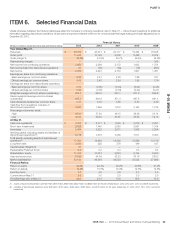
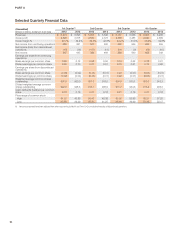
Please find page 27 of the 2013 Nike annual report below. You can navigate through the pages in the report by either clicking on the pages listed below, or by using the keyword search tool below to find specific information within the annual report.-
 1
1 -
2
-
3
-
4
-
5
-
6
-
7
-
8
-
9
-
10
-
11
-
12
-
13
-
14
-
15
-
16
-
 17
17 -
 18
18 -
 19
19 -
 20
20 -
 21
21 -
 22
22 -
 23
23 -
 24
24 -
 25
25 -
 26
26 -
 27
27 -
 28
28 -
 29
29 -
 30
30 -
 31
31 -
 32
32 -
 33
33 -
 34
34 -
 35
35 -
 36
36 -
 37
37 -
38
-
39
-
40
-
41
-
42
-
43
-
44
-
45
-
46
-
47
-
48
-
49
-
50
-
51
-
52
-
53
-
54
-
55
-
56
-
57
-
58
-
59
-
60
-
61
-
62
-
63
-
64
-
65
-
66
-
67
-
68
-
69
-
70
-
71
-
72
-
73
-
74
-
75
-
76
-
77
-
78
-
79
-
80
-
81
-
82
-
83
-
84
 |
 |
PART II
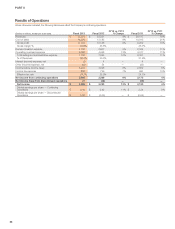
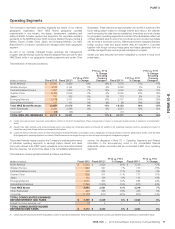
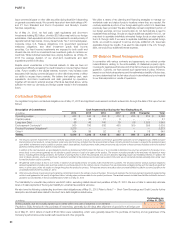
North America
(Dollars in millions) Fiscal 2013 Fiscal 2012
FY13 vs. FY12
% Change
FY13 vs. FY12
% Change
Excluding
Currency
Changes Fiscal 2011
FY12 vs. FY11
% Change
FY12 vs. FY11
%Change
Excluding
Currency
Changes
Revenues by:
Footwear $ 6,687 $ 5,887 14% 14% $ 5,111 15% 15%
Apparel 3,028 2,482 22% 22% 2,103 18% 18%
Equipment 672 470 43% 43% 365 29% 29%
TOTAL REVENUES $ 10,387 $ 8,839 18% 18% $ 7,579 17% 17%
Revenues by:
Sales to Wholesale Customers $ 7,838 $ 6,720 17% 17% $ 5,801 16% 16%
Sales Direct to Consumer 2,549 2,119 20% 20% 1,778 19% 19%
TOTAL REVENUES $ 10,387 $ 8,839 18% 18% $ 7,579 17% 17%
EARNINGS BEFORE INTEREST
AND TAXES $ 2,534 $ 2,030 25% $ 1,736 17%
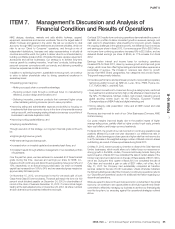
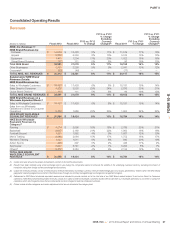
Fiscal 2013 Compared to Fiscal 2012
Our category offense continued to deliver innovative products, deep brand
connections, and compelling retail experiences to consumers in North
America, driving increased demand for NIKE Brand products across all key
categories except Action Sports. Our Basketball, Men’s Training, Running,
and Sportswear categories drove the revenue growth in fiscal 2013. North
America’s Direct to Consumer revenue growth for fiscal 2013 was fueled by
15% growth in comparable store sales as well as the addition of new stores
and rapid growth in online sales.
North America footwear revenue growth was driven by higher demand in all
seven key categories, most notably Basketball, Running, and Sportswear.
Both unit sales and average selling price per pair increased 7% in fiscal 2013.
The increase in average selling price per pair was driven approximately equally
by price increases and a favorable mix of higher priced products.
Apparel revenue growth in North America was driven by higher demand in our
Men’s Training category, reflecting the addition of the NFL licensed business,
as well as Basketball, Women’s Training, and Running. Unit sales increased
10% while average selling price per unit increased 12%, largely driven by a
favorable mix of higher priced products.
North America EBIT increased faster than revenue due to gross margin
expansion and selling and administrative expense leverage. Gross margin
increased 50 basis points for fiscal 2013, reflecting the favorable impact of
selling price increases, partially offset by higher product costs, an unfavorable
mix of lower margin products and royalties for the NFL business. Selling and
administrative expenses increased versus fiscal 2012, though at a rate slower
than revenue; the growth was largely driven by higher demand creation
expense for the Olympics in the first quarter of fiscal 2013 as well as key
product initiatives, including the NFL launch, and higher operating overhead
costs to support the expansion of our Direct to Consumer business and
overall growth of the business.
Fiscal 2012 Compared to Fiscal 2011
Revenues for North America increased 17% for fiscal 2012, driven by growth
in both wholesale and Direct to Consumer revenues. Our category offense
continued to deliver innovative products, deep brand connections and
compelling retail experiences to consumers, driving demand for NIKE Brand
products across all seven key categories. North America’s Direct to
Consumer revenues grew 19% for fiscal 2012, driven by 15% growth in
comparable store sales.
For fiscal 2012, footwear revenue in North America increased 15%, driven by
an increase in both unit sales and average selling prices. Unit sales rose at a
double-digit rate while average selling price per pair grew at a mid-single-digit
rate, reflective of product price increases, partially offset by higher discounts
on close-out sales. The overall increase in footwear sales was driven by
growth in all key categories, most notably Running, Basketball, Women’s
Training and Sportswear.
Compared to the prior year, apparel revenue for North America increased
18%, primarily driven by a low-double-digit percentage growth in average
selling price per unit and a mid-single-digit percentage growth in unit sales.
The increase in average selling price per unit was reflective of product price
increases and a greater mix of higher price point products. The overall
increase in apparel sales was driven by double-digit percentage growth
across most key categories, including Men’s Training, Running and
Basketball.
For fiscal 2012, EBIT for North America increased 17% as revenue growth
and improved selling and administrative expense leverage more than offset a
decline in gross margin. Gross margin decreased 90 basis points during fiscal
2012, primarily due to higher product input costs and lower gross margins on
close-out sales, which more than offset the favorable impact of selling price
increases, lower air freight costs and the growth of our Direct to Consumer
business. Selling and administrative expense as a percentage of revenue
decreased by 70 basis points for fiscal 2012, as both demand creation and
operating overhead expense grew at a slower rate than revenues.
72