Nike 2013 Annual Report Download - page 61
Download and view the complete annual report
Please find page 61 of the 2013 Nike annual report below. You can navigate through the pages in the report by either clicking on the pages listed below, or by using the keyword search tool below to find specific information within the annual report.-
 1
1 -
2
-
3
-
4
-
5
-
6
-
7
-
8
-
9
-
10
-
11
-
12
-
13
-
14
-
15
-
16
-
17
-
18
-
19
-
20
-
21
-
22
-
23
-
24
-
25
-
26
-
27
-
28
-
29
-
30
-
31
-
32
-
33
-
34
-
35
-
36
-
37
-
38
-
39
-
40
-
41
-
42
-
43
-
44
-
45
-
46
-
47
-
48
-
49
-
50
-
 51
51 -
 52
52 -
 53
53 -
 54
54 -
 55
55 -
 56
56 -
 57
57 -
 58
58 -
 59
59 -
 60
60 -
 61
61 -
 62
62 -
 63
63 -
 64
64 -
 65
65 -
 66
66 -
 67
67 -
 68
68 -
 69
69 -
 70
70 -
 71
71 -
72
-
73
-
74
-
75
-
76
-
77
-
78
-
79
-
80
-
81
-
82
-
83
-
84
 |
 |
PART II
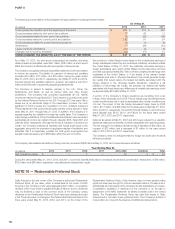
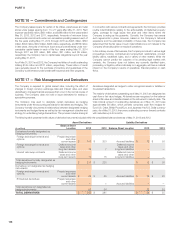
The weighted average contractual life remaining for options outstanding and
options exercisable at May 31, 2013 was 6.3 years and 4.7 years,
respectively. The aggregate intrinsic value for options outstanding and
exercisable at May 31, 2013 was $1,823 million and $1,218 million,
respectively. The aggregate intrinsic value was the amount by which the
market value of the underlying stock exceeded the exercise price of the
options. The total intrinsic value of the options exercised during the years
ended May 31, 2013, 2012, and 2011 was $293 million, $453 million, and
$267 million, respectively.
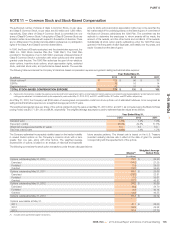
In addition to the 1990 Plan, the Company gives employees the right to
purchase shares at a discount to the market price under employee stock
purchase plans (“ESPPs”). Employees are eligible to participate through
payroll deductions of up to 10% of their compensation. At the end of each six-
month offering period, shares are purchased by the participants at 85% of the
lower of the fair market value at the beginning or the end of the offering period.
Employees purchased 1.6 million, 1.7 million, and 1.6 million shares during
each of the three years ended May 31, 2013, 2012 and 2011, respectively.
From time to time, the Company grants restricted stock units and restricted
stock to key employees under the 1990 Plan. The number of shares
underlying such awards granted to employees during the years ended
May 31, 2013, 2012, and 2011 were 1.6 million, 0.7 million, and 0.4 million
with weighted average values per share of $46.86, $49.49, and $35.11,
respectively. Recipients of restricted stock are entitled to cash dividends and
to vote their respective shares throughout the period of restriction. Recipients
of restricted stock units are entitled to dividend equivalent cash payments
upon vesting. The value of all grants of restricted stock and restricted stock
units was established by the market price on the date of grant. During the
years ended May 31, 2013, 2012, and 2011, the aggregate fair value of
restricted stock and restricted stock units vested was $25 million, $22 million,
and $15 million, respectively, determined as of the date of vesting.
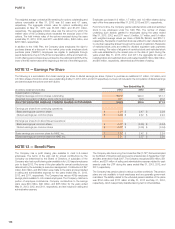
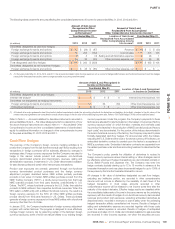
NOTE 12 — Earnings Per Share
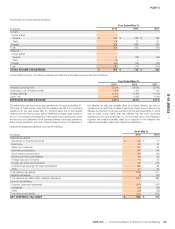
The following is a reconciliation from basic earnings per share to diluted earnings per share. Options to purchase an additional 0.1 million, 0.2 million, and
0.3 million shares of common stock were outstanding at May 31, 2013, 2012, and 2011 respectively, but were not included in the computation of diluted earnings
per share because the options were anti-dilutive.
Year Ended May 31,
(In millions, except per share data) 2013 2012 2011
Determination of shares:
Weighted average common shares outstanding 897.3 920.0 951.1
Assumed conversion of dilutive stock options and awards 19.1 19.6 20.2
DILUTED WEIGHTED AVERAGE COMMON SHARES OUTSTANDING 916.4 939.6 971.3
Earnings per share from continuing operations:
Basic earnings per common share $ 2.75 $ 2.47 $ 2.28
Diluted earnings per common share $ 2.69 $ 2.42 $ 2.24
Earnings per share from discontinued operations:
Basic earnings per common share $ 0.02 $ (0.05) $ (0.04)
Diluted earnings per common share $ 0.02 $ (0.05) $ (0.04)
Basic earnings per common share for NIKE, Inc. $ 2.77 $ 2.42 $ 2.24
Diluted earnings per common share for NIKE, Inc. $ 2.71 $ 2.37 $ 2.20
NOTE 13 — Benefit Plans
The Company has a profit sharing plan available to most U.S.-based
employees. The terms of the plan call for annual contributions by the
Company as determined by the Board of Directors. A subsidiary of the
Company also had a profit sharing plan available to its U.S.-based employees
prior to fiscal 2012. The terms of the plan called for annual contributions as
determined by the subsidiary’s executive management. Contributions of $47
million, $40 million, and $39 million were made to the plans and are included
in selling and administrative expense for the years ended May 31, 2013,
2012, and 2011, respectively. The Company has various 401(k) employee
savings plans available to U.S.-based employees. The Company matches a
portion of employee contributions. Company contributions to the savings
plans were $46 million, $42 million, and $38 million for the years ended
May 31, 2013, 2012, and 2011, respectively, and are included in selling and
administrative expense.
The Company also has a Long-Term Incentive Plan (“LTIP”) that was adopted
by the Board of Directors and approved by shareholders in September 1997
and later amended in fiscal 2007. The Company recognized $50 million, $51
million, and $31 million of selling and administrative expense related to cash
awards under the LTIP during the years ended May 31, 2013, 2012, and
2011, respectively.
The Company has pension plans in various countries worldwide. The pension
plans are only available to local employees and are generally government
mandated. The liability related to the unfunded pension liabilities of the plans
was $104 million and $113 million at May 31, 2013 and May 31, 2012,
respectively, which was primarily classified as long-term in other liabilities.
106