Nike 2013 Annual Report Download - page 67
Download and view the complete annual report
Please find page 67 of the 2013 Nike annual report below. You can navigate through the pages in the report by either clicking on the pages listed below, or by using the keyword search tool below to find specific information within the annual report.-
 1
1 -
2
-
3
-
4
-
5
-
6
-
7
-
8
-
9
-
10
-
11
-
12
-
13
-
14
-
15
-
16
-
17
-
18
-
19
-
20
-
21
-
22
-
23
-
24
-
25
-
26
-
27
-
28
-
29
-
30
-
31
-
32
-
33
-
34
-
35
-
36
-
37
-
38
-
39
-
40
-
41
-
42
-
43
-
44
-
45
-
46
-
47
-
48
-
49
-
50
-
51
-
52
-
53
-
54
-
55
-
56
-
 57
57 -
 58
58 -
 59
59 -
 60
60 -
 61
61 -
 62
62 -
 63
63 -
 64
64 -
 65
65 -
 66
66 -
 67
67 -
 68
68 -
 69
69 -
 70
70 -
 71
71 -
 72
72 -
 73
73 -
 74
74 -
 75
75 -
 76
76 -
 77
77 -
78
-
79
-
80
-
81
-
82
-
83
-
84
 |
 |

PART II
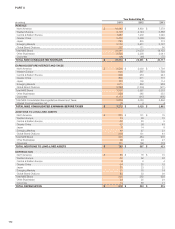
Year Ended May 31,
(In millions) 2013 2012 2011
REVENUE
North America $ 10,387 $ 8,839 $ 7,579
Western Europe 4,128 4,144 3,868
Central & Eastern Europe 1,287 1,200 1,040
Greater China 2,453 2,539 2,060
Japan 791 835 773
Emerging Markets 3,718 3,411 2,737
Global Brand Divisions 117 111 96
Total NIKE Brand 22,881 21,079 18,153
Other Businesses 2,500 2,298 2,041
Corporate (68) (46) (77)
TOTAL NIKE CONSOLIDATED REVENUES $ 25,313 $ 23,331 $ 20,117
EARNINGS BEFORE INTEREST AND TAXES
North America $ 2,534 $ 2,030 $ 1,736
Western Europe 640 597 730
Central & Eastern Europe 259 234 244
Greater China 809 911 777
Japan 133 136 114
Emerging Markets 1,011 853 688
Global Brand Divisions (1,396) (1,200) (971)
Total NIKE Brand 3,990 3,561 3,318
Other Businesses 456 385 353
Corporate (1,177) (917) (805)
Total NIKE Consolidated Earnings Before Interest and Taxes 3,269 3,029 2,866
Interest (income) expense, net (3) 4 4
TOTAL NIKE CONSOLIDATED EARNINGS BEFORE TAXES $ 3,272 $ 3,025 $ 2,862
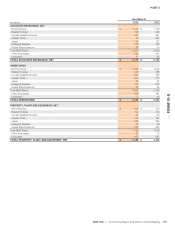
ADDITIONS TO LONG-LIVED ASSETS
North America $ 201 $ 131 $ 79
Western Europe 74 93 75
Central & Eastern Europe 22 20 5
Greater China 52 38 43
Japan 614 9
Emerging Markets 49 27 21
Global Brand Divisions 216 131 44
Total NIKE Brand 620 454 276
Other Businesses 29 24 27
Corporate 131 109 118
TOTAL ADDITIONS TO LONG-LIVED ASSETS $ 780 $ 587 $ 421
DEPRECIATION
North America $ 85 $ 78 $ 70
Western Europe 68 62 52
Central & Eastern Europe 964
Greater China 34 25 19
Japan 21 23 22
Emerging Markets 20 15 14
Global Brand Divisions 83 53 39
Total NIKE Brand 320 262 220
Other Businesses 24 25 24
Corporate 74 66 71
TOTAL DEPRECIATION $ 418 $ 353 $ 315
112