Nike 2013 Annual Report Download - page 23
Download and view the complete annual report
Please find page 23 of the 2013 Nike annual report below. You can navigate through the pages in the report by either clicking on the pages listed below, or by using the keyword search tool below to find specific information within the annual report.-
 1
1 -
2
-
3
-
4
-
5
-
6
-
7
-
8
-
9
-
10
-
11
-
12
-
 13
13 -
 14
14 -
 15
15 -
 16
16 -
 17
17 -
 18
18 -
 19
19 -
 20
20 -
 21
21 -
 22
22 -
 23
23 -
 24
24 -
 25
25 -
 26
26 -
 27
27 -
 28
28 -
 29
29 -
 30
30 -
 31
31 -
 32
32 -
 33
33 -
34
-
35
-
36
-
37
-
38
-
39
-
40
-
41
-
42
-
43
-
44
-
45
-
46
-
47
-
48
-
49
-
50
-
51
-
52
-
53
-
54
-
55
-
56
-
57
-
58
-
59
-
60
-
61
-
62
-
63
-
64
-
65
-
66
-
67
-
68
-
69
-
70
-
71
-
72
-
73
-
74
-
75
-
76
-
77
-
78
-
79
-
80
-
81
-
82
-
83
-
84
 |
 |

PART II
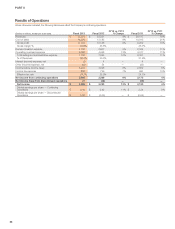
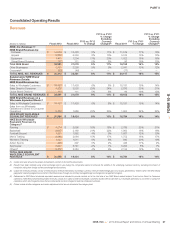
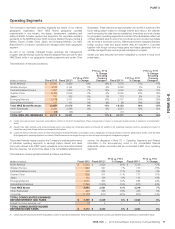
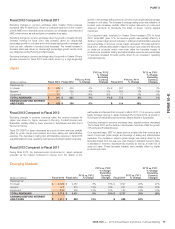
Fiscal 2013 Compared to Fiscal 2012
On a currency neutral basis, revenues from our NIKE, Inc. continuing
operations grew 11% for fiscal 2013, driven by increases in revenues for both
the NIKE Brand and our Other Businesses. Every NIKE Brand geography
except Greater China delivered higher revenues for fiscal 2013. North
America contributed 7 percentage points of the increase in NIKE, Inc.
revenues, while Emerging Markets contributed 2 percentage points and
Western and Central and Eastern Europe each contributed 1 percentage
point. Greater China’s results reduced NIKE, Inc. revenue growth by 1
percentage point. Revenues for our Other Businesses contributed 1
percentage point to our consolidated revenue growth.
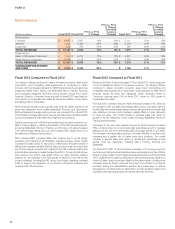
Excluding the effects of changes in currency exchange rates, NIKE Brand
footwear and apparel revenue increased 11% and 10%, respectively, while
NIKE Brand equipment revenues increased 20% during fiscal 2013. The
increase in NIKE Brand footwear revenue for fiscal 2013 was attributable to
growth across our Running, Basketball, Football (Soccer), and Sportswear
categories. The growth of NIKE footwear revenues continued to be fueled by
increased demand for performance products, including Running models with
NIKE FREE and Lunar technologies, NIKE and Brand Jordan Basketball
styles, and performance Football (soccer) products. In fiscal 2013, unit sales
of footwear increased approximately 7% and the average selling price per pair
increased approximately 4%, driven equally by price increases and a shift in
mix to higher priced products.
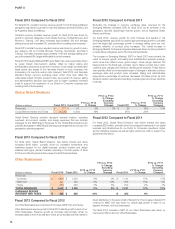
For NIKE Brand apparel, the increase in revenue for fiscal 2013 was driven by
our Men’s Training category (which includes the NFL licensed business), in
addition to strong demand for Running and Basketball products. Apparel unit
sales in fiscal 2013 increased approximately 7% and the average selling price
per unit increased approximately 3%, reflecting a favorable mix of higher
priced products, such as performance Running, Basketball, and NFL licensed
apparel, and to a lesser extent, higher selling prices.
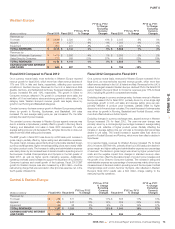
While wholesale revenues remain the largest component of overall NIKE
Brand revenues, we continue to expand Direct to Consumer revenues. Our
NIKE Brand Direct to Consumer operations include NIKE owned in-line and
factory stores, as well as online sales through NIKE owned websites. For fiscal
2013, Direct to Consumer revenues represented approximately 19% of our
total NIKE Brand revenues compared to 17% in fiscal 2012. On a currency
neutral basis, Direct to Consumer revenues grew 24% for fiscal 2013, as
comparable store sales grew 14% and we continue to expand our store
network and e-commerce business. Comparable store sales include
revenues from NIKE owned in-line and factory stores for which all three of the
following requirements have been met: (1) the store has been open at least
one year, (2) square footage has not changed by more than 15% within the
past year, and (3) the store has not been permanently repositioned within the
past year.
Revenues for our Other Businesses are comprised of results from Converse,
Hurley and NIKE Golf. Excluding the impact of currency changes, revenues
for these businesses increased 9% in fiscal 2013, reflecting growth across all
businesses.
Fiscal 2012 Compared to Fiscal 2011
On a currency neutral basis, revenues for NIKE, Inc.’s continuing operations
grew 15% for fiscal 2012, driven by increases in revenues for both the NIKE
Brand and our Other Businesses. Excluding the effects of changes in
currency exchange rates, revenues for the NIKE Brand increased 15%, as
every NIKE Brand geography delivered higher revenues for fiscal 2012. North
America contributed approximately 7 percentage points to the NIKE Brand
revenue increase, while the Emerging Markets and Greater China
geographies contributed approximately 4 and 2 percentage points to the
NIKE Brand revenue growth, respectively. Revenues for our Other
Businesses grew 12% during fiscal 2012, contributing 1 percentage point of
our consolidated revenue growth.
Excluding the effects of changes in currency exchange rates, NIKE Brand
footwear and apparel revenue increased 15% and 13%, respectively, while
NIKE Brand equipment revenues increased 16% during fiscal 2012.
Continuing to fuel the growth of our NIKE Brand footwear business was the
increased demand for performance products, including the NIKE Lunar and
FREE technologies. The increase in NIKE Brand footwear revenue for fiscal
2012 was attributable to double-digit percentage growth in unit sales along
with a low-single-digit percentage increase in average selling price per pair,
primarily reflecting the favorable impact from product price increases, partially
offset by higher discounts on close-out sales. The overall increase in footwear
sales was driven by growth across all key categories, notably Running,
Sportswear and Basketball. For NIKE Brand apparel, the increase in revenue
for fiscal 2012 was driven by mid-single-digit percentage increases in both
unit sales and average selling prices. The increase in average selling prices
was primarily driven by product price increases, partially offset by a higher mix
of close-out sales. The overall increase in apparel sales was reflective of
increased demand across most key categories.
For fiscal 2012, Direct to Consumer channels represented approximately
17% of our total NIKE Brand revenues compared to 16% in fiscal 2011. On a
currency neutral basis, Direct to Consumer revenues grew 21% for fiscal
2012, as comparable store sales grew 13% and we continue to expand our
store network and e-commerce business.
Revenues for our Other Businesses consisted of results from our affiliate
brands; Converse, Hurley and NIKE Golf. Excluding the impact of currency
changes, revenues for these businesses increased by 12% in fiscal 2012,
reflecting growth across all businesses except Hurley, which was down
slightly for the fiscal year.
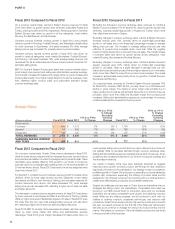
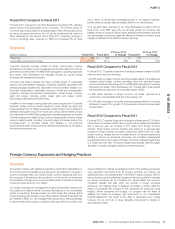
Futures Orders
Futures orders for NIKE Brand footwear and apparel scheduled for delivery
from June through November 2013 were 8% higher than the orders reported
for the comparable prior year period. The U.S. Dollar futures order amount is
calculated based upon our internal forecast of the currency exchange rates
under which our revenues will be translated during this period. Excluding the
impact of currency changes, futures orders also increased 8%, as unit orders
contributed approximately 5 percentage points of growth and average selling
price per unit contributed approximately 3 percentage points of growth.
By geography, futures orders growth was as follows:
Reported Futures
Orders Growth Futures Orders Excluding
Currency Changes(1)
North America 12% 12%
Western Europe 2% 0%
Central & Eastern Europe 14% 12%
Greater China 3% 0%
Japan -17% 6%
Emerging Markets 12% 12%
Total NIKE Brand Futures Orders 8% 8%
(1) Growth rates have been restated using constant exchange rates for the comparative period to enhance the visibility of the underlying business trends excluding the impact of foreign
currency exchange rate fluctuations.
68