Nike 2013 Annual Report Download - page 30
Download and view the complete annual report
Please find page 30 of the 2013 Nike annual report below. You can navigate through the pages in the report by either clicking on the pages listed below, or by using the keyword search tool below to find specific information within the annual report.-
 1
1 -
2
-
3
-
4
-
5
-
6
-
7
-
8
-
9
-
10
-
11
-
12
-
13
-
14
-
15
-
16
-
17
-
18
-
19
-
 20
20 -
 21
21 -
 22
22 -
 23
23 -
 24
24 -
 25
25 -
 26
26 -
 27
27 -
 28
28 -
 29
29 -
 30
30 -
 31
31 -
 32
32 -
 33
33 -
 34
34 -
 35
35 -
 36
36 -
 37
37 -
 38
38 -
 39
39 -
 40
40 -
41
-
42
-
43
-
44
-
45
-
46
-
47
-
48
-
49
-
50
-
51
-
52
-
53
-
54
-
55
-
56
-
57
-
58
-
59
-
60
-
61
-
62
-
63
-
64
-
65
-
66
-
67
-
68
-
69
-
70
-
71
-
72
-
73
-
74
-
75
-
76
-
77
-
78
-
79
-
80
-
81
-
82
-
83
-
84
 |
 |
PART II
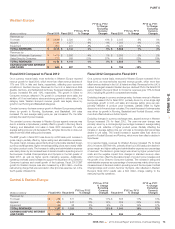
Fiscal 2012 Compared to Fiscal 2011
Excluding changes in currency exchange rates, Greater China revenues
increased 18% for fiscal 2012, driven by continued expansion in the number
of both NIKE mono-branded stores owned by our wholesale customers and
NIKE owned stores, as well as higher comparable store sales.
Excluding changes in currency exchange rates, the growth in Greater China’s
footwear revenue for fiscal 2012 was primarily driven by double-digit
percentage growth in unit sales and a mid-single-digit growth in average unit
price per pair, reflective of product price increases. The overall increase in
footwear sales was driven by double-digit percentage growth across most
key categories, led by Running and Sportswear.
Excluding changes in currency exchange rates, the growth in Greater China’s
apparel revenues for fiscal 2012 was mainly driven by a high-single-digit
growth in the average selling price per unit and a low-single-digit percentage
increase in unit sales. The increase in average selling price was reflective of
product price increases, partially offset by higher discounts on in-line and
close-out products to accelerate the sales of slower moving apparel
inventories.
On a reported basis, revenues for Greater China increased 23% for fiscal
2012, while EBIT grew 17%, as revenue growth was partially offset by a
decline in gross margin and an increase in selling and administrative expense
as a percentage of revenues. Gross margin decreased 150 basis points for
fiscal 2012, primarily attributable to higher product input costs and discounts
on close-out products, which more than offset the favorable impact of
product price increases. Selling and administrative expense as a percentage
of revenues increased 50 basis points, driven by an increase in operating
overhead expense.
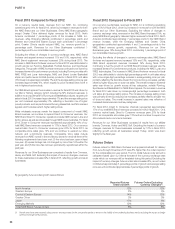
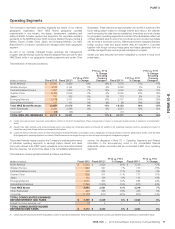
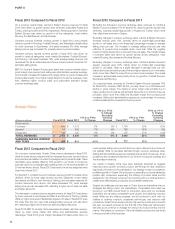
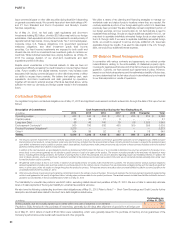
Japan
(Dollars in millions) Fiscal 2013 Fiscal 2012
FY13 vs. FY12
% Change
FY13 vs. FY12
% Change
Excluding
Currency
Changes Fiscal 2011
FY12 vs. FY11
% Change
FY12 vs. FY11
% Change
Excluding
Currency
Changes
Revenues by:
Footwear $ 429 $ 439 -2% 5% $ 397 11% 3%
Apparel 301 325 -7% -1% 305 7% -1%
Equipment 61 71 -14% -9% 71 0% -5%
TOTAL REVENUES $ 791 $ 835 -5% 1% $ 773 8% 1%
EARNINGS BEFORE INTEREST
AND TAXES $ 133 $ 136 -2% $ 114 19%
Fiscal 2013 Compared to Fiscal 2012
Excluding changes in currency exchange rates, the revenue increase for
Japan was driven by higher revenues in Running, Football (Soccer) and
Basketball, partially offset by lower revenues in Sportswear and Men’s and
Women’s Training.
Fiscal 2013 EBIT for Japan decreased as a result of lower revenues, partially
offset by gross margin improvement and lower selling and administrative
expense. The decrease in selling and administrative expense in fiscal 2013
was attributable to lower operating overhead and demand creation spending.
Fiscal 2012 Compared to Fiscal 2011
During fiscal 2012, the macroeconomic environment in Japan remained
uncertain as the market continued to recover from the effects of the
earthquake and tsunami that occurred in March 2011. On a currency neutral
basis, footwear revenue in Japan increased 3% for fiscal 2012, as growth in
Running and Football (Soccer) more than offset a decline in Sportswear.
Excluding changes in currency exchange rates, apparel revenue decreased
1% for fiscal 2012, as the decline in Sportswear more than offset the growth
in Running and Football (Soccer).
On a reported basis, EBIT for Japan grew at a faster rate than revenue as a
result of improved gross margin and leverage of selling and administrative
expenses. The increase in Japan’s gross margin was mainly driven by the
favorable impact from the year-over-year change in standard currency rates,
a decrease in inventory obsolescence expense as well as a lower mix of
close-out sales. These favorable impacts were partially offset by higher
product input costs.
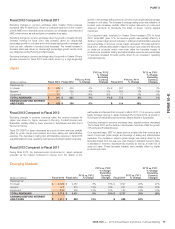
Emerging Markets
(Dollars in millions) Fiscal 2013 Fiscal 2012
FY13 vs. FY12
% Change
FY13 vs. FY12
% Change
Excluding
Currency
Changes Fiscal 2011
FY12 vs. FY11
% Change
FY12 vs. FY11
% Change
Excluding
Currency
Changes
Revenues by:
Footwear $ 2,570 $ 2,387 8% 15% $ 1,897 26% 27%
Apparel 918 815 13% 19% 657 24% 25%
Equipment 230 209 10% 17% 183 14% 15%
TOTAL REVENUES $ 3,718 $ 3,411 9% 16% $ 2,737 25% 26%
EARNINGS BEFORE INTEREST
AND TAXES $ 1,011 $ 853 19% $ 688 24%
NIKE, INC. 2013 Annual Report and Notice of Annual Meeting 75
FORM 10-K