Nike 2013 Annual Report Download - page 29
Download and view the complete annual report
Please find page 29 of the 2013 Nike annual report below. You can navigate through the pages in the report by either clicking on the pages listed below, or by using the keyword search tool below to find specific information within the annual report.-
 1
1 -
2
-
3
-
4
-
5
-
6
-
7
-
8
-
9
-
10
-
11
-
12
-
13
-
14
-
15
-
16
-
17
-
18
-
 19
19 -
 20
20 -
 21
21 -
 22
22 -
 23
23 -
 24
24 -
 25
25 -
 26
26 -
 27
27 -
 28
28 -
 29
29 -
 30
30 -
 31
31 -
 32
32 -
 33
33 -
 34
34 -
 35
35 -
 36
36 -
 37
37 -
 38
38 -
 39
39 -
40
-
41
-
42
-
43
-
44
-
45
-
46
-
47
-
48
-
49
-
50
-
51
-
52
-
53
-
54
-
55
-
56
-
57
-
58
-
59
-
60
-
61
-
62
-
63
-
64
-
65
-
66
-
67
-
68
-
69
-
70
-
71
-
72
-
73
-
74
-
75
-
76
-
77
-
78
-
79
-
80
-
81
-
82
-
83
-
84
 |
 |

PART II
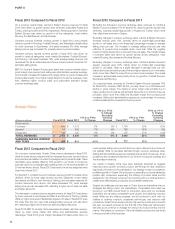
Fiscal 2013 Compared to Fiscal 2012
On a currency neutral basis, Central & Eastern Europe revenues for fiscal
2013 were driven by growth across most territories, particularly Russia and
Turkey, which grew 28% and 19%, respectively. Revenue growth in Central &
Eastern Europe was driven by growth in all key categories, most notably
Running, Football (Soccer), and Sportswear.
Constant currency footwear revenue growth in fiscal 2013 was primarily
driven by growth in Running, Football (Soccer), and Basketball, partially offset
by lower revenues in Sportswear. Unit sales increased 6% while average
selling price per pair increased 5%, primarily driven by price increases.
Constant currency apparel revenue growth in fiscal 2013 was driven by
growth in nearly all categories, most notably Sportswear, Football (Soccer),
and Running. Unit sales increased 16%, while average selling price per unit
decreased 2%, as an unfavorable mix of lower priced products more than off-
set higher selling prices.
EBIT for Central & Eastern Europe grew faster than revenue primarily due to
gross margin improvement and selling and administrative expense leverage.
Gross margin increased 30 basis points, largely driven by price increases and
the favorable impact of our higher margin Direct to Consumer business, more
than offsetting higher product costs and unfavorable standard foreign
currency exchange rates.
Fiscal 2012 Compared to Fiscal 2011
Excluding the changes in currency exchange rates, revenues for Central &
Eastern Europe increased 17% for fiscal 2012, driven by growth across most
territories, including double-digit growth in Russia and Turkey, which more
than offset lower revenues in Greece.
Excluding changes in currency exchange rates, Central & Eastern Europe’s
footwear revenue grew 13%, primarily driven by double-digit percentage
growth in unit sales and a low-single-digit percentage increase in average
selling price per pair. The increase in average selling price per pair was
reflective of product price increases which more than offset the negative
impact of higher discounts on in-line and close-out sales. The overall increase
in footwear sales was driven by growth across all key categories, most
notably Running, Sportswear and Football (Soccer).
Excluding changes in currency exchange rates, Central & Eastern Europe’s
apparel revenues grew 24%, mainly driven by double-digit percentage
growth in unit sales, offset by a slight decrease in average price per unit,
mainly due to less favorable product mix and higher discounts on in-line sales,
which more than offset the impact from product price increases. The overall
increase in apparel sales was primarily driven by growth in Football (Soccer),
Sportswear and Running.
On a reported basis, revenues for Central & Eastern Europe increased 15%
for fiscal 2012. However, EBIT fell 4%, primarily driven by a 420 basis point
decline in gross margin. The decline in gross margin was primarily due to
higher product input costs as well as higher discounts on in-line and close-out
products, which more than offset the favorable impact from product price
increases. Selling and administrative expense as a percentage of revenues
remained relatively flat compared to the prior period.
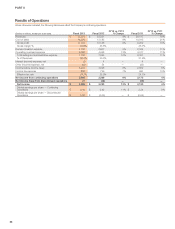
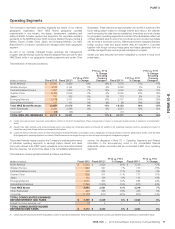
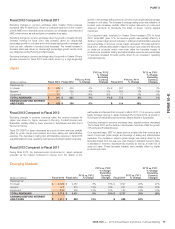
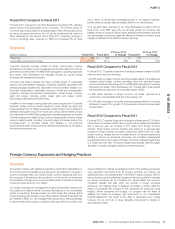
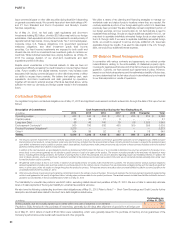
Greater China
(Dollars in millions) Fiscal 2013 Fiscal 2012
FY13 vs. FY12
% Change
FY13 vs. FY12
% Change
Excluding
Currency
Changes Fiscal 2011
FY12 vs. FY11
% Change
FY12 vs. FY11
% Change
Excluding
Currency
Changes
Revenues by:
Footwear $ 1,493 $ 1,518 -2% -3% $ 1,164 30% 25%
Apparel 829 896 -7% -9% 789 14% 9%
Equipment 131 125 5% 3% 107 17% 12%
TOTAL REVENUES $ 2,453 $ 2,539 -3% -5% $ 2,060 23% 18%
EARNINGS BEFORE INTEREST
AND TAXES $ 809 $ 911 -11% $ 777 17%
Fiscal 2013 Compared to Fiscal 2012
On a currency neutral basis, Greater China revenue decreased in fiscal 2013,
driven by lower futures orders as well as increased discounts, product returns
and proactive cancellation of orders to manage inventory levels at retail. These
downsides were partially offset by 33% growth in our Direct to Consumer
business driven by comparable store sales growth of 13% and the addition of
29 net new factory stores. Fiscal 2013 revenues for most key categories were
lower than in fiscal 2012.
For fiscal 2013, constant currency footwear revenue growth for Greater China
declined, driven by lower sales across most key categories, most notably
Sportswear and Men’s and Women’s Training, and increased reserves for
product discounts and returns. Unit sales decreased 1%, while average
selling price per pair decreased 2%, reflecting a higher mix of close-out sales
and higher discounts.
The decrease in constant currency apparel revenue for fiscal 2013 was driven
by lower revenues in Sportswear and Men’s and Women’s Training, partially
offset by higher revenues in Basketball. Apparel unit sales in fiscal 2013 were
3% lower than the prior year while average selling price per unit was down
6%, reflecting a higher mix of close-out sales and higher discounts.
Fiscal 2013 EBIT for Greater China decreased at a faster rate than revenue,
driven by lower gross margin and selling and administrative expense
deleverage. Fiscal 2013 gross margin decreased 50 basis points due to a
lower average selling price per unit driven by higher discounts and close-out
mix partially offset by favorable standard foreign currency exchange rates.
Selling and administrative expense increased as a percent of revenues, driven
primarily by the increased investment in our Direct to Consumer business and
the decrease in revenues.
Our results in Greater China have been adversely impacted by sluggish
macroeconomic growth and slow product sell-through at retail, leading to
high levels of inventory in the marketplace. Our strategy to return to sustained,
profitable growth in Greater China focuses on extending our brand leadership
position with consumers; expanding the offering of product styles and fits
designed for the Chinese consumer; and working with our retail partners to
create more differentiated, productive, and profitable retail stores.
Despite the challenges we have seen in China, there are indications that our
strategies are taking hold in the marketplace. Comparable store sales are
growing in our NIKE-owned Direct to Consumer doors and our wholesale
customers are reporting comparable store growth and declining inventory
levels. While we are making progress, we will continue to work with our
retailers to optimize inventory, accelerate sell-through, and improve retail
productivity. While China futures orders for the next six months are in line with
last year, we expect revenues for the first half of the fiscal year will be below
last year as we continue to manage the amount of product we ship into the
market. We believe our revenue in China will stabilize around prior year levels
in the second half of this fiscal year.
74