Metro PCS 2010 Annual Report Download - page 96
Download and view the complete annual report
Please find page 96 of the 2010 Metro PCS annual report below. You can navigate through the pages in the report by either clicking on the pages listed below, or by using the keyword search tool below to find specific information within the annual report.-
 1
1 -
2
-
3
-
4
-
5
-
6
-
7
-
8
-
9
-
10
-
11
-
12
-
13
-
14
-
15
-
16
-
17
-
18
-
19
-
20
-
21
-
22
-
23
-
24
-
25
-
26
-
27
-
28
-
29
-
30
-
31
-
32
-
33
-
34
-
35
-
36
-
37
-
38
-
39
-
40
-
41
-
42
-
43
-
44
-
45
-
46
-
47
-
48
-
49
-
50
-
51
-
52
-
53
-
54
-
55
-
56
-
57
-
58
-
59
-
60
-
61
-
62
-
63
-
64
-
65
-
66
-
67
-
68
-
69
-
70
-
71
-
72
-
73
-
74
-
75
-
76
-
77
-
78
-
79
-
80
-
81
-
82
-
83
-
84
-
85
-
 86
86 -
 87
87 -
 88
88 -
 89
89 -
 90
90 -
 91
91 -
 92
92 -
 93
93 -
 94
94 -
 95
95 -
 96
96 -
 97
97 -
 98
98 -
 99
99 -
 100
100 -
 101
101 -
 102
102 -
 103
103 -
 104
104 -
 105
105 -
 106
106 -
107
-
108
-
109
-
110
-
111
-
112
-
113
-
114
-
115
-
116
-
117
-
118
-
119
-
120
-
121
-
122
-
123
-
124
-
125
-
126
-
127
-
128
-
129
-
130
-
131
-
132
-
133
-
134
-
135
-
136
-
137
-
138
-
139
-
140
-
141
-
142
-
143
-
144
-
145
-
146
-
147
-
148
 |
 |

86
On December 1, 2010, we closed on a like-kind spectrum exchange agreement covering licenses in certain
metropolitan areas with the Service Provider. We acquired 10 MHz of AWS spectrum in Orlando in exchange for
10 MHz of PCS spectrum in Ft. Pierce-Vero Beach-Stuart, Florida, 10 MHz of partitioned AWS spectrum in the Salt
Lake City and Portland cellular marketing areas and total cash consideration of $3.0 million. The exchange of
spectrum resulted in a gain on disposal of assets in the amount of $26.6 million.
Off-Balance Sheet Arrangements
We do not have any off-balance sheet arrangements.
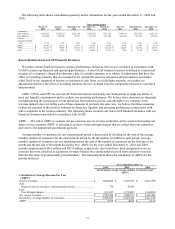
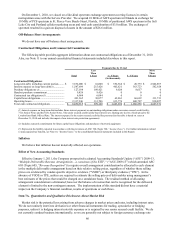
Contractual Obligations and Commercial Commitments
The following table provides aggregate information about our contractual obligations as of December 31, 2010.
Also, see Note 11 to our annual consolidated financial statements included elsewhere in this report.
Pa
y
ments Due b
y
Period
Total
Less
Than
1Year 1-3Years 3 - 5 Years
More
Than
5 Years
(In thousands)
Contractual Obli
g
ations:
Long-term debt, including current portion ........
.
$ 3,532,000 $ 16,000 $ 552,364 $ 20,779 $ 2,942,857
Interest expense on long-term debt(1) ...............
.
1,547,694 215,426 405,621 363,723 562,924
Purchase obligations (2) ....................................
.
127,104 109,421 9,026 8,657 0
Handset purchase commitment .........................
.
9,426 9,426 0 0 0
Contractual tax obligations (3) ..........................
.
6,084 6,084 0 0 0
Capital lease obligations ...................................
.
491,365 30,077 62,863 66,692 331,733
Operating leases ................................................
.
2,337,246 312,706 613,776 600,707 810,057
Total cash contractual obligations ....................
.
$ 8,050,919 $ 699,140 $ 1,643,650 $ 1,060,558 $ 4,647,571
____________________________
(1) Interest expense on long-term debt includes future interest payments on outstanding obligations under our senior secured credit facility,
7Ǭ% Senior Notes and the 6ǫ% Senior Notes. The senior secured credit facility bears interest at a floating rate tied to a fixed spread to the
London Inter Bank Offered Rate. The interest expense for the senior secured credit facility presented in this table is based on rates at
December 31, 2010 and includes the impact of our interest rate protection agreements.
(2) Includes expected commitments for future capital lease obligations and purchases of network equipment.
(3) Represents the liability reported in accordance with the provisions of ASC 740 (Topic 740, “Income Taxes”). For further information related
to unrecognized tax benefits, see Note 14, “Income Taxes,” to the consolidated financial statements included in this Report.
Inflation
We believe that inflation has not materially affected our operations.
Effect of New Accounting Standards
Effective January 1, 2011, the Company prospectively adopted Accounting Standards Update (“ASU”) 2009-13,
“Multiple Deliverable Revenue Arrangements – a consensus of the EITF, “ (“ASU 2009-13”) which amended ASC
605 (Topic 605, “Revenue Recognition”) to require overall arrangement consideration be allocated to each element
in the multiple deliverable arrangement based on their relative selling prices, regardless of whether those selling
prices are evidenced by vendor-specific objective evidence (“VSOE”) or third party evidence (“TPE”). In the
absence of VSOE or TPE, entities are required to estimate the selling prices of deliverables using management’s
best estimates of the prices that would be charged on a standalone basis. The residual method of allocating
arrangement consideration is eliminated; however the balance of revenue that can be recognized for the delivered
element is limited to the non-contingent amount. The implementation of this standard did not have a material
impact on the Company’s financial condition, results of operations or cash flows.
Item 7A. Quantitative and Qualitative Disclosures About Market Risk
Market risk is the potential loss arising from adverse changes in market prices and rates, including interest rates.
We do not routinely enter into derivatives or other financial instruments for trading, speculative or hedging
purposes, unless it is hedging interest rate risk exposure or is required by our senior secured credit facility. We do
not currently conduct business internationally, so we are generally not subject to foreign currency exchange rate