Metro PCS 2010 Annual Report Download - page 86
Download and view the complete annual report
Please find page 86 of the 2010 Metro PCS annual report below. You can navigate through the pages in the report by either clicking on the pages listed below, or by using the keyword search tool below to find specific information within the annual report.-
 1
1 -
2
-
3
-
4
-
5
-
6
-
7
-
8
-
9
-
10
-
11
-
12
-
13
-
14
-
15
-
16
-
17
-
18
-
19
-
20
-
21
-
22
-
23
-
24
-
25
-
26
-
27
-
28
-
29
-
30
-
31
-
32
-
33
-
34
-
35
-
36
-
37
-
38
-
39
-
40
-
41
-
42
-
43
-
44
-
45
-
46
-
47
-
48
-
49
-
50
-
51
-
52
-
53
-
54
-
55
-
56
-
57
-
58
-
59
-
60
-
61
-
62
-
63
-
64
-
65
-
66
-
67
-
68
-
69
-
70
-
71
-
72
-
73
-
74
-
75
-
 76
76 -
 77
77 -
 78
78 -
 79
79 -
 80
80 -
 81
81 -
 82
82 -
 83
83 -
 84
84 -
 85
85 -
 86
86 -
 87
87 -
 88
88 -
 89
89 -
 90
90 -
 91
91 -
 92
92 -
 93
93 -
 94
94 -
 95
95 -
 96
96 -
97
-
98
-
99
-
100
-
101
-
102
-
103
-
104
-
105
-
106
-
107
-
108
-
109
-
110
-
111
-
112
-
113
-
114
-
115
-
116
-
117
-
118
-
119
-
120
-
121
-
122
-
123
-
124
-
125
-
126
-
127
-
128
-
129
-
130
-
131
-
132
-
133
-
134
-
135
-
136
-
137
-
138
-
139
-
140
-
141
-
142
-
143
-
144
-
145
-
146
-
147
-
148
 |
 |
76
offerings and the launch of our services in the New York and Boston metropolitan areas in early 2009.
Churn. As we do not require a long-term service contract, our churn percentage is expected to be higher than
traditional wireless carriers that require customers to sign a one- to two-year contract with significant early
termination fees. Average monthly churn represents (a) the number of customers who have been disconnected from
our system during the measurement period less the number of customers who have reactivated service, divided by
(b) the sum of the average monthly number of customers during such period. We classify delinquent customers as
churn after they have been delinquent for 30 days. In addition, when an existing customer establishes a new account
in connection with the purchase of an upgraded or replacement phone and does not identify themselves as an
existing customer, we count the phone leaving service as a churn and the new phone entering service as a gross
customer addition (“false churn”). Churn for the year ended December 31, 2010 was 3.6%, compared to 5.5% for
the year ended December 31, 2009. The decrease in churn was primarily related to the acceptance of our Wireless
for All tax and regulatory fee inclusive service plans including a decline in false churn as we no longer offer the first
month of service for free. Our customer activity is influenced by seasonal effects related to traditional retail selling
periods and other factors that arise from our target customer base. Based on historical results, we generally expect
net customer additions to be strongest in the first and fourth quarters. Softening of sales and increased churn in the
second and third quarters of the year usually combine to result in fewer net customer additions during these quarters.
See – “Seasonality.”
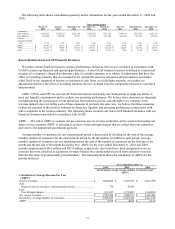
Average Revenue Per User. ARPU represents (a) service revenues plus impact to service revenues of
promotional activity less pass through charges for the measurement period, divided by (b) the sum of the average
monthly number of customers during such period. ARPU was $39.79 and $40.68 for year ended December 31,
2010 and 2009, respectively. The $0.89 decrease in ARPU was primarily attributable to the new Wireless for All
service plans that were introduced in January 2010, which include all applicable taxes and regulatory fees. ARPU
was $41.39 for the year ended December 31, 2008. The $0.71 decrease in ARPU for the year ended December 31,
2009, was primarily attributable to higher participation in our Family Plans and promotional service plans offered
during 2009, as well as reduced revenue from certain features included in our service plans that were previously
provided a la carte. These decreases were partially offset by our unlimited international calling plan that launched in
June 2009.
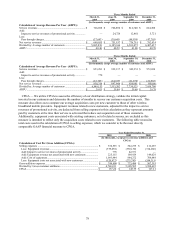
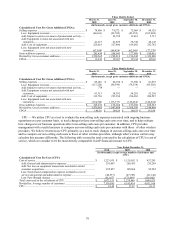
Cost Per Gross Addition. CPGA is determined by dividing (a) selling expenses plus the total cost of equipment
associated with transactions with new customers less equipment revenues associated with transactions with new
customers during the measurement period adjusted for impact to service revenues of promotional activity by
(b) gross customer additions during such period. Retail customer service expenses and equipment margin on
handsets sold to existing customers when they are identified, including handset upgrade transactions, are excluded,
as these costs are incurred specifically for existing customers. CPGA costs increased to $157.26 for the year ended
December 31, 2010 from $145.79 for the year ended December 31, 2009. This increase in CPGA was primarily
driven by various promotional activities as well as lower gross additions. CPGA increased to $145.79 for the year
ended December 31, 2009 from $127.21 for the year ended December 31, 2008, which was primarily driven by the
launches of service in New York and Boston metropolitan areas in early 2009, combined with increased promotional
activities.
Cost Per User. CPU is determined by dividing (a) cost of service and general and administrative costs (excluding
applicable stock-based compensation expense included in cost of service and general and administrative expense)
plus net loss on handset equipment transactions unrelated to initial customer acquisition, divided by (b) the sum of
the average monthly number of customers during such period. CPU for the year ended December 31, 2010 and 2009
was $18.49 and $17.23, respectively. The $1.26 increase in CPU for the year ended December 31, 2010 was
primarily driven by the increase in handset subsidies for upgrades by existing customers, the inclusion of regulatory
fees in our Wireless for All service plans as well as costs associated with our 4G LTE network upgrade. CPU for the
year ended December 31, 2008 was $18.17. The $0.94 decrease in CPU for the year ended December 31, 2009, was
primarily driven by cost benefits due to the increasing scale of our business. However, these benefits were partially
offset by the costs associated with our unlimited international calling plan as well as the launch expenses and ramp
up of operations in the New York and Boston metropolitan areas.