Metro PCS 2010 Annual Report Download - page 109
Download and view the complete annual report
Please find page 109 of the 2010 Metro PCS annual report below. You can navigate through the pages in the report by either clicking on the pages listed below, or by using the keyword search tool below to find specific information within the annual report.-
 1
1 -
2
-
3
-
4
-
5
-
6
-
7
-
8
-
9
-
10
-
11
-
12
-
13
-
14
-
15
-
16
-
17
-
18
-
19
-
20
-
21
-
22
-
23
-
24
-
25
-
26
-
27
-
28
-
29
-
30
-
31
-
32
-
33
-
34
-
35
-
36
-
37
-
38
-
39
-
40
-
41
-
42
-
43
-
44
-
45
-
46
-
47
-
48
-
49
-
50
-
51
-
52
-
53
-
54
-
55
-
56
-
57
-
58
-
59
-
60
-
61
-
62
-
63
-
64
-
65
-
66
-
67
-
68
-
69
-
70
-
71
-
72
-
73
-
74
-
75
-
76
-
77
-
78
-
79
-
80
-
81
-
82
-
83
-
84
-
85
-
86
-
87
-
88
-
89
-
90
-
91
-
92
-
93
-
94
-
95
-
96
-
97
-
98
-
 99
99 -
 100
100 -
 101
101 -
 102
102 -
 103
103 -
 104
104 -
 105
105 -
 106
106 -
 107
107 -
 108
108 -
 109
109 -
 110
110 -
 111
111 -
 112
112 -
 113
113 -
 114
114 -
 115
115 -
 116
116 -
 117
117 -
 118
118 -
 119
119 -
120
-
121
-
122
-
123
-
124
-
125
-
126
-
127
-
128
-
129
-
130
-
131
-
132
-
133
-
134
-
135
-
136
-
137
-
138
-
139
-
140
-
141
-
142
-
143
-
144
-
145
-
146
-
147
-
148
 |
 |

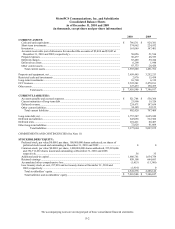
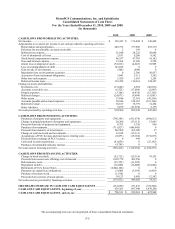
The accompanying notes are an integral part of these consolidated financial statements.
F-3
MetroPCS Communications, Inc. and Subsidiaries
Consolidated Statements of Income and Comprehensive Income
For the Years Ended December 31, 2010, 2009 and 2008
(in thousands, except share and per share information)
2010 2009 2008
REVENUES:
Service revenues .................................................................................... $ 3,689,695 $ 3,130,385 $ 2,437,250
Equipment revenues ............................................................................... 379,658 350,130 314,266
Total revenues ................................................................................... 4,069, 353 3,480,515 2,751,516
OPERATING EXPENSES:
Cost of service (exclusive of depreciation and amortization expense
of $393,721, $332,319 and $225,911, shown separately below) ......... 1,223,931 1,120,052 857,295
Cost of equipment .................................................................................. 1,093,944 884,272 704,648
Selling, general and administrative expenses (exclusive of
depreciation and amortization expense of $56,011, $45,537 and
$29,408, shown separately below) ....................................................... 621,660 567,730 447,582
Depreciation and amortization............................................................... 449,732 377,856 255,319
(Gain) loss on disposal of assets ............................................................ (38,812) (4,683) 18,905
Total operating expenses ................................................................... 3,350,455 2,945,227 2,283,749
Income from operations .......................................................................... 718,898 535,288 467,767
OTHER EXPENSE (INCOME):
Interest expense ..................................................................................... 263,125 270,285 179,398
Interest income ...................................................................................... (1,954) (2,870) (22,947)
Other expense, net ................................................................................. 1,807 1,808 1,035
Loss on extinguishment of debt ............................................................. 143,626 0 0
Impairment loss on investment securities .............................................. 02,386 30,857
Total other expense ........................................................................... 406,604 271,609 188,343
Income before provision for income taxes .............................................. 312,294 263,679 279,424
Provision for income taxes .................................................................. (118,879) (86,835) (129,986)
Net income .............................................................................................. $ 193,415 $ 176,844 $ 149,438
Other comprehensive income:
Unrealized gains on available-for-sale securities, net of tax of
$242, $294, and $1, respectively ..................................................... 361 3,210 830
Unrealized losses on cash flow hedging derivatives, net of tax of
$4,879, $9,521, and $20,429, respectively ...................................... (7,268) (14,710) (30,438)
Reclassification adjustment for gains on available-for-sale
securities included in net income, net of tax of $227, $250, and
$0 respectively ................................................................................ (338) (394) 0
Reclassification adjustment for losses on cash flow hedging
derivatives included in net income, net of tax of $11,526,
$21,247, and $7,862, respectively ................................................... 17,170 33,087 11,544
Total other comprehensive income (loss) ......................................... 9,925 21,193 (18,064)
Comprehensive income ........................................................................... $ 203,340 $ 198,037 $ 131,374
Net income per common share: (See Note 15)
Basic ...................................................................................................... $ 0.54 $ 0.50 $ 0.43
Dilute
d
................................................................................................... $ 0.54 $ 0.49 $ 0.42
Weighted average shares:
Basic ...................................................................................................... 353,711,045 351,898,898 349,395,285
Dilute
d
................................................................................................... 356,135,089 355,942,921 355,380,111