Metro PCS 2010 Annual Report Download - page 108
Download and view the complete annual report
Please find page 108 of the 2010 Metro PCS annual report below. You can navigate through the pages in the report by either clicking on the pages listed below, or by using the keyword search tool below to find specific information within the annual report.-
 1
1 -
2
-
3
-
4
-
5
-
6
-
7
-
8
-
9
-
10
-
11
-
12
-
13
-
14
-
15
-
16
-
17
-
18
-
19
-
20
-
21
-
22
-
23
-
24
-
25
-
26
-
27
-
28
-
29
-
30
-
31
-
32
-
33
-
34
-
35
-
36
-
37
-
38
-
39
-
40
-
41
-
42
-
43
-
44
-
45
-
46
-
47
-
48
-
49
-
50
-
51
-
52
-
53
-
54
-
55
-
56
-
57
-
58
-
59
-
60
-
61
-
62
-
63
-
64
-
65
-
66
-
67
-
68
-
69
-
70
-
71
-
72
-
73
-
74
-
75
-
76
-
77
-
78
-
79
-
80
-
81
-
82
-
83
-
84
-
85
-
86
-
87
-
88
-
89
-
90
-
91
-
92
-
93
-
94
-
95
-
96
-
97
-
 98
98 -
 99
99 -
 100
100 -
 101
101 -
 102
102 -
 103
103 -
 104
104 -
 105
105 -
 106
106 -
 107
107 -
 108
108 -
 109
109 -
 110
110 -
 111
111 -
 112
112 -
 113
113 -
 114
114 -
 115
115 -
 116
116 -
 117
117 -
 118
118 -
119
-
120
-
121
-
122
-
123
-
124
-
125
-
126
-
127
-
128
-
129
-
130
-
131
-
132
-
133
-
134
-
135
-
136
-
137
-
138
-
139
-
140
-
141
-
142
-
143
-
144
-
145
-
146
-
147
-
148
 |
 |

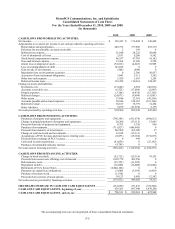
The accompanying notes are an integral part of these consolidated financial statements.
F-2
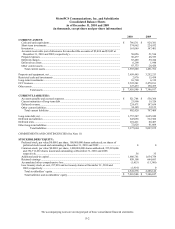
MetroPCS Communications, Inc. and Subsidiaries
Consolidated Balance Sheets
As of December 31, 2010 and 2009
(in thousands, except share and per share information)
2010 2009
CURRENT ASSETS:
Cash and cash equivalents ......................................................................................................... $ 796,531 $ 929,381
Short-term investments .............................................................................................................. 374,862 224,932
Inventories ................................................................................................................................. 161,049 147,401
Accounts receivable (net of allowance for uncollectible accounts of $2,494 and $2,045 at
December 31, 2010 and 2009, respectively)............................................................................ 58,056 51,536
Prepaid expenses ....................................................................................................................... 50,477 48,353
Deferred charges ........................................................................................................................ 83,485 59,414
Deferred tax assets ..................................................................................................................... 6,290 1,948
Other current assets ................................................................................................................... 63,135 28,426
Total current assets ................................................................................................................ 1,593,885 1,491,391
Property and equipment, net .......................................................................................................... 3,659,445 3,252,213
Restricted cash and investments .................................................................................................... 2,876 15,438
Long-term investments .................................................................................................................. 16,700 6,319
FCC licenses .................................................................................................................................. 2,522,241 2,470,181
Other assets .................................................................................................................................... 123,433 150,475
Total assets ...................................................................................................................$ 7,918,580
$ 7,386,017
CURRENT LIABILITIES:
Accounts payable and accrued expenses ................................................................................... $ 521,788 $ 558,366
Current maturities of long-term debt ......................................................................................... 21,996 19,326
Deferred revenue ....................................................................................................................... 224,471 187,654
Other current liabilities .............................................................................................................. 34,165 32,123
Total current liabilities .......................................................................................................... 802,420 797,469
Long-term debt, net ....................................................................................................................... 3,757,287 3,625,949
Deferred tax liabilities ................................................................................................................... 643,058 512,306
Deferred rents ................................................................................................................................ 101,411 80,487
Other long-term liabilities .............................................................................................................. 72,828 81,664
Total liabilities .............................................................................................................. 5,377,004 5,097,875
COMMITMENTS AND CONTINGENCIES (See Note 11)
STOCKHOLDERS’ EQUITY:
Preferred stock, par value $0.0001 per share, 100,000,000 shares authorized; no shares of
p
referred stock issued and outstanding at December 31, 2010 and 2009 ................................ 0 0
Common stock, par value $0.0001 per share, 1,000,000,000 shares authorized, 355,318,666
and 352,711,263 shares issued and outstanding at December 31, 2010 and 2009,
respectively ............................................................................................................................. 36 35
Additional pai
d
-in capital .......................................................................................................... 1,686,761 1,634,754
Retained earnings ...................................................................................................................... 858,108 664,693
Accumulated other comprehensive loss ..................................................................................... (1,415) (11,340)
Less treasury stock, at cost, 237,818 and no treasury shares at December 31, 2010 and
2009, respectively.................................................................................................................... (1,914) 0
Total stockholders’ equity .....................................................................................................2,541,576 2,288,142
Total liabilities and stockholders’ equity ............................................................................... $ 7,918,580
$ 7,386,017