Metro PCS 2010 Annual Report Download - page 139
Download and view the complete annual report
Please find page 139 of the 2010 Metro PCS annual report below. You can navigate through the pages in the report by either clicking on the pages listed below, or by using the keyword search tool below to find specific information within the annual report.
MetroPCS Communications, Inc. and Subsidiaries
Notes to Consolidated Financial Statements
December 31, 2010, 2009 and 2008
F-33
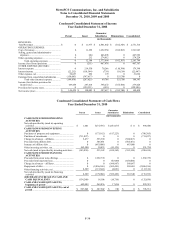
Consolidated Statement of Income
Year Ended December 31, 2010
Parent Issuer
Guarantor
Subsidiaries Eliminations Consolidated
(in thousands)
REVENUES:
Total Revenues ...................................... $ 0 $ 16,036 $ 4,277,726 $ (224,409) $ 4,069,353
OPERATING EXPENSES:
Cost of revenues .................................... 0 15,200 2,527,084 (224,409) 2,317,875
Selling, general and administrative
expenses .............................................. 0 835 620,825 0 621,660
Other operating expenses ...................... 0 16,773 394,147 0 410,920
Total operating expenses ............. 0 32,808 3,542,056 (224,409) 3,350,455
(Loss) income from operations.............. 0 (16,772) 735,670 0 718,898
OTHER EXPENSE (INCOME):
Interest expense ..................................... 0 252,661 153,672 (143,208) 263,125
Interest income ...................................... (1,797) (143,308) (57) 143,208 (1,954)
Other expense (income), ne
t
.................. 0 1,915 (108) 0 1,807
Earnings from consolidated
subsidiaries .......................................... (191,546) (581,027) 0 772,573 0
Loss on extinguishment of deb
t
............ 0 143,626 0 0 143,626
Total other (income) expense ...... (193,343) (326,133) 153,507 772,573 406,604
Income (loss) before provision for
income taxes ........................................ 193,343 309,361 582,163 (772,573) 312,294
Provision for income taxes .................... 72 (117,815) (1,136) 0 (118,879)
Net income (loss) ................................. $ 193,415 $ 191,546 $ 581,027 $ (772,573) $ 193,415
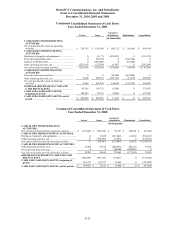
Year Ended December 31, 2009
Parent Issuer
Guarantor
Subsidiaries Eliminations Consolidated
(in thousands)
REVENUES:
Total Revenues ...................................... $ 0 $ 16,409 $ 3,628,698 $ (164,592) $ 3,480,515
OPERATING EXPENSES:
Cost of revenues .................................... 0 15,336 2,153,580 (164,592) 2,004,324
Selling, general and administrative
expenses .............................................. 0 1,074 566,656 0 567,730
Other operating expenses ...................... 0 228 372,945 0 373,173
Total operating expenses ............. 0 16,638 3,093,181 (164,592) 2,945,227
(Loss) income from operations.............. 0 (229) 535,517 0 535,288
OTHER EXPENSE (INCOME):
Interest expense ..................................... 0 270,662 135,039 (135,416) 270,285
Interest income ...................................... (4,842) (133,298) (146) 135,416 (2,870)
Other expense (income), ne
t
.................. 2,386 1,786 22 0 4,194
Earnings from consolidated
subsidiaries .......................................... (174,388) (402,358) 0 576,746 0
Total other (income) expense ...... (176,844) (263,208) 134,915 576,746 271,609
Income (loss) before provision for
income taxes ........................................ 176,844 262,979 400,602 (576,746) 263,679
Provision for income taxes .................... 0 (88,591) 1,756 0 (86,835)
Net income (loss) $ 176,844 $ 174,388 $ 402,358 $ (576,746) $ 176,844
Condensed
Consolidated Statement of Income
Condensed


