Metro PCS 2010 Annual Report Download - page 93
Download and view the complete annual report
Please find page 93 of the 2010 Metro PCS annual report below. You can navigate through the pages in the report by either clicking on the pages listed below, or by using the keyword search tool below to find specific information within the annual report.-
 1
1 -
2
-
3
-
4
-
5
-
6
-
7
-
8
-
9
-
10
-
11
-
12
-
13
-
14
-
15
-
16
-
17
-
18
-
19
-
20
-
21
-
22
-
23
-
24
-
25
-
26
-
27
-
28
-
29
-
30
-
31
-
32
-
33
-
34
-
35
-
36
-
37
-
38
-
39
-
40
-
41
-
42
-
43
-
44
-
45
-
46
-
47
-
48
-
49
-
50
-
51
-
52
-
53
-
54
-
55
-
56
-
57
-
58
-
59
-
60
-
61
-
62
-
63
-
64
-
65
-
66
-
67
-
68
-
69
-
70
-
71
-
72
-
73
-
74
-
75
-
76
-
77
-
78
-
79
-
80
-
81
-
82
-
 83
83 -
 84
84 -
 85
85 -
 86
86 -
 87
87 -
 88
88 -
 89
89 -
 90
90 -
 91
91 -
 92
92 -
 93
93 -
 94
94 -
 95
95 -
 96
96 -
 97
97 -
 98
98 -
 99
99 -
 100
100 -
 101
101 -
 102
102 -
 103
103 -
104
-
105
-
106
-
107
-
108
-
109
-
110
-
111
-
112
-
113
-
114
-
115
-
116
-
117
-
118
-
119
-
120
-
121
-
122
-
123
-
124
-
125
-
126
-
127
-
128
-
129
-
130
-
131
-
132
-
133
-
134
-
135
-
136
-
137
-
138
-
139
-
140
-
141
-
142
-
143
-
144
-
145
-
146
-
147
-
148
 |
 |
83
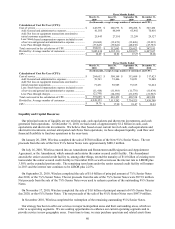
Investing Activities
Cash used in investing activities was $950.4 million during the year ended December 31, 2010 compared to $1.1
billion during the year ended December 31, 2009. The decrease was due primarily to a $74.8 million decrease in net
purchases and maturities of short-term investments during the year ended December 31, 2010, coupled with a $61.3
million increase in cash flows from changes in prepaid purchases of property and equipment and an approximate
$41.3 million decrease in purchases of property and equipment.
Cash used in investing activities was $1.1 billion during the year ended December 31, 2009 compared to
approximately $1.3 billion during the year ended December 31, 2008. The decrease was due primarily to a $313.0
million decrease in purchases of FCC licenses as well as a $122.9 million decrease in purchases of property and
equipment, partially offset by an approximate $224.2 million increase in net purchases of short-term investments.
Cash used in investing activities was $1.3 billion during the year ended December 31, 2008 compared to $517.1
million during the year ended December 31, 2007. The increase was due primarily to $328.5 million in purchases of
FCC licenses, $25.2 million in cash used for business acquisitions, a $186.9 million increase in purchases of
property and equipment which was primarily related to construction in the Philadelphia, New York and Boston
metropolitan areas, and $267.2 million in net proceeds from the sale of investments during the year ended December
31, 2007 that did not recur during the year ended December 31, 2008.
Financing Activities
Cash used in financing activities was $176.9 million during the year ended December 31, 2010 compared to cash
provided by financing activities of $449.0 million during the year ended December 31, 2009. The decrease during
2010 was mainly attributable to $2.0 billion in cash used for the redemption of the 9¼% Senior Notes as well as an
approximate $62.4 million decrease in book overdraft, partially offset by a net $1.5 billion increase in proceeds from
the issuance of senior notes.
Cash provided by financing activities was $449.0 million during the year ended December 31, 2009 compared to
$74.5 million during the year ended December 31, 2008. The increase was due primarily to $480.3 million in net
proceeds from the issuance of the New 9¼% Senior Notes in January 2009, partially offset by an approximate $99.7
million decrease in book overdraft.
Cash provided by financing activities was $74.5 million for the year ended December 31, 2008 compared to $1.2
billion for year ended December 31, 2007. The decrease was due primarily to $818.3 million in net proceeds from
the Company’s initial public offering that was completed in April 2007 and $420.4 million in net proceeds from the
issuance of the additional notes in June 2007 that occurred during the year ended December 31, 2007 compared to
the year ended December 31, 2008.
Senior Secured Credit Facility
Wireless, an indirect wholly-owned subsidiary of MetroPCS Communications, Inc., entered into the Senior
Secured Credit Facility on November 3, 2006, or senior secured credit facility. The senior secured credit facility
consists of a $1.6 billion term loan facility and a $100 million revolving credit facility. The term loan facility is
repayable in quarterly installments in annual aggregate amounts equal to 1% of the initial aggregate principal
amount of $1.6 billion. The term loan facility will mature in November 2013. The revolving credit facility will
mature in November 2011.
On July 16, 2010, Wireless entered into an Amendment and Restatement and Resignation and Appointment
Agreement (the “Amendment”) which amends and restates the Senior Secured Credit Facility. The Amendment
amends the Senior Secured Credit Facility to, among other things, extend the maturity of $1.0 billion of existing
term loans under the Senior Secured Credit Facility to November 2016, increase the interest rate to LIBOR plus
3.50% on the extended portion only and reduce the revolving credit facility from $100.0 million to $67.5 million.
The remaining term loans under the Senior Secured Credit Facility will mature in 2013 and the interest rate for this
portion continues to be LIBOR plus 2.25%. This modification did not result in a loss on extinguishment of debt.
The facilities under the senior secured credit agreement are guaranteed by MetroPCS Communications, Inc.,
MetroPCS, Inc. and each of Wireless’ direct and indirect present and future wholly-owned domestic subsidiaries.
The senior secured credit facility contains customary events of default, including cross defaults. The obligations are