Metro PCS 2010 Annual Report Download - page 83
Download and view the complete annual report
Please find page 83 of the 2010 Metro PCS annual report below. You can navigate through the pages in the report by either clicking on the pages listed below, or by using the keyword search tool below to find specific information within the annual report.-
 1
1 -
2
-
3
-
4
-
5
-
6
-
7
-
8
-
9
-
10
-
11
-
12
-
13
-
14
-
15
-
16
-
17
-
18
-
19
-
20
-
21
-
22
-
23
-
24
-
25
-
26
-
27
-
28
-
29
-
30
-
31
-
32
-
33
-
34
-
35
-
36
-
37
-
38
-
39
-
40
-
41
-
42
-
43
-
44
-
45
-
46
-
47
-
48
-
49
-
50
-
51
-
52
-
53
-
54
-
55
-
56
-
57
-
58
-
59
-
60
-
61
-
62
-
63
-
64
-
65
-
66
-
67
-
68
-
69
-
70
-
71
-
72
-
 73
73 -
 74
74 -
 75
75 -
 76
76 -
 77
77 -
 78
78 -
 79
79 -
 80
80 -
 81
81 -
 82
82 -
 83
83 -
 84
84 -
 85
85 -
 86
86 -
 87
87 -
 88
88 -
 89
89 -
 90
90 -
 91
91 -
 92
92 -
 93
93 -
94
-
95
-
96
-
97
-
98
-
99
-
100
-
101
-
102
-
103
-
104
-
105
-
106
-
107
-
108
-
109
-
110
-
111
-
112
-
113
-
114
-
115
-
116
-
117
-
118
-
119
-
120
-
121
-
122
-
123
-
124
-
125
-
126
-
127
-
128
-
129
-
130
-
131
-
132
-
133
-
134
-
135
-
136
-
137
-
138
-
139
-
140
-
141
-
142
-
143
-
144
-
145
-
146
-
147
-
148
 |
 |

73
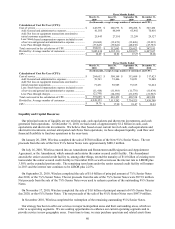
Provision for Income Taxes. Income tax expense was approximately $118.9 million and approximately $86.8
million for the years ended December 31, 2010 and 2009, respectively. The effective tax rate was approximately
38.1% and 32.9% for the year ended December 31, 2010 and 2009, respectively. For the years ended December 31,
2010 and 2009, our effective rate differs from the statutory federal rate of 35.0% due to net state and local taxes, tax
credits, non-deductible expenses, valuation allowance on impairment on investment securities and a net change in
uncertain tax positions. Provision for income taxes for the year ended December 31, 2010 includes a benefit of $6.9
million related to income tax credits. Provision for income taxes for the year ended December 31, 2009 includes a
net decrease in a state unrecognized tax benefit of $18.1 million due to the expiration of a statute of limitations.
Net Income. Net income increased approximately $16.6 million, or 9%, to $193.4 million for the year ended
December 31, 2010 compared to $176.8 million for the year ended December 31, 2009. The increase was primarily
attributable to a 34% increase in income from operations combined with an approximate 3% decrease in interest
expense, partially offset by an approximate 37% increase in provision for income taxes and a loss on extinguishment
of debt.
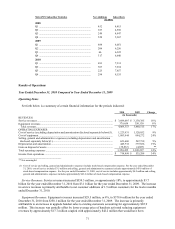
Results of Operations
Year Ended December 31, 2009 Compared to Year Ended December 31, 2008
Operating Items
Set forth below is a summary of certain financial information for the periods indicated:
2009
2008 Change
(in thousands)
REVENUES:
Service revenues ................................................................................................................. $ 3,130,385 $ 2,437,250 28%
Equipment revenues ............................................................................................................ 350,130 314,266 11%
Total revenues .................................................................................................................. 3,480,515 2,751,516 26%
OPERATING EXPENSES:
Cost of service (excluding depreciation and amortization disclosed separately below)(1).. 1,120,052 857,295 31%
Cost of equipment ............................................................................................................... 884,272 704,648 26%
Selling, general and administrative expenses (excluding depreciation and amortization
disclosed separately below)(1).......................................................................................... 567,730 447,582 27%
Depreciation and amortization ............................................................................................ 377,856 255,319 48%
(Gain) loss on disposal of assets ......................................................................................... (4,683) 18,905 125%
Total operating expenses .................................................................................................... 2,945,227 2,283,749 29%
Income from operations ...................................................................................................... $ 535,288 $ 467,767 14%
________________________
(1) Cost of service and selling, general and administrative expenses include stock-based compensation expense. For the year ended December
31, 2009, cost of service includes $4.2 million and selling, general and administrative expenses includes $43.6 million of stock-based
compensation expense. For the year ended December 31, 2008, cost of service includes $2.9 million and selling, general and administrative
expenses includes $38.2 million of stock-based compensation expense.
Service Revenues. Service revenues increased $693.1 million, or 28%, to $3.1 billion for the year ended
December 31, 2009 from $2.4 billion for the year ended December 31, 2008. The increase in service revenues is
primarily attributable to net customer additions of approximately 1.3 million customers for the year ended December
31, 2009. Offsetting these revenues, in accordance with ASC 605, is $42.9 million that would have been recognized
as service revenues but was classified as equipment revenues during the year ended December 31, 2009, because the
consideration received from customers was less than the fair value of promotionally priced handsets.
Equipment Revenues. Equipment revenues increased $35.8 million, or 11%, to $350.1 million for the year ended
December 31, 2009 from approximately $314.3 million for the year ended December 31, 2008. The increase is
primarily attributable to an increase in gross additions and an increase in upgrade handset sales to existing customers
accounting for approximately $37.9 million. In addition, in accordance with ASC 605, approximately $42.9 million
that would have been recognized as service revenues was classified as equipment revenues during the year ended
December 31, 2009, because the consideration received from customers was less than the fair value of
promotionally priced handsets. These increases were partially offset by lower average price of handsets activated
reducing equipment revenues by approximately $45.6 million.