Metro PCS 2010 Annual Report Download - page 88
Download and view the complete annual report
Please find page 88 of the 2010 Metro PCS annual report below. You can navigate through the pages in the report by either clicking on the pages listed below, or by using the keyword search tool below to find specific information within the annual report.-
 1
1 -
2
-
3
-
4
-
5
-
6
-
7
-
8
-
9
-
10
-
11
-
12
-
13
-
14
-
15
-
16
-
17
-
18
-
19
-
20
-
21
-
22
-
23
-
24
-
25
-
26
-
27
-
28
-
29
-
30
-
31
-
32
-
33
-
34
-
35
-
36
-
37
-
38
-
39
-
40
-
41
-
42
-
43
-
44
-
45
-
46
-
47
-
48
-
49
-
50
-
51
-
52
-
53
-
54
-
55
-
56
-
57
-
58
-
59
-
60
-
61
-
62
-
63
-
64
-
65
-
66
-
67
-
68
-
69
-
70
-
71
-
72
-
73
-
74
-
75
-
76
-
77
-
 78
78 -
 79
79 -
 80
80 -
 81
81 -
 82
82 -
 83
83 -
 84
84 -
 85
85 -
 86
86 -
 87
87 -
 88
88 -
 89
89 -
 90
90 -
 91
91 -
 92
92 -
 93
93 -
 94
94 -
 95
95 -
 96
96 -
 97
97 -
 98
98 -
99
-
100
-
101
-
102
-
103
-
104
-
105
-
106
-
107
-
108
-
109
-
110
-
111
-
112
-
113
-
114
-
115
-
116
-
117
-
118
-
119
-
120
-
121
-
122
-
123
-
124
-
125
-
126
-
127
-
128
-
129
-
130
-
131
-
132
-
133
-
134
-
135
-
136
-
137
-
138
-
139
-
140
-
141
-
142
-
143
-
144
-
145
-
146
-
147
-
148
 |
 |

78
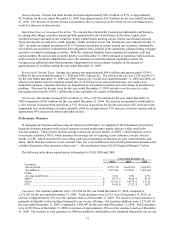
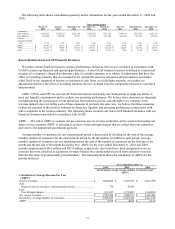
Three Months Ended
March 31,
2009
June 30,
2009
September 30,
2009
December 31,
2009
(In thousands, except average number of customers and ARPU)
Calculation of Avera
g
e Revenue Per User (ARPU):
Service revenues ....................................................................... $ 726,698 $ 766,850 $ 812,340 $ 824,498
Add:
Impact to service revenues of promotional activity ............... — 24,728 12,481 5,721
Less:
Pass through charges .............................................................. (37,643) (39,641) (48,030) (47,785)
Net service revenues ................................................................. $ 689,055 $ 751,937 $ 776,791 $ 782,434
Divided by: Average number of customers .............................. 5,685,830 6,185,166 6,303,075 6,407,637
ARPU ....................................................................................... $ 40.40 $ 40.52 $ 41.08 $ 40.70
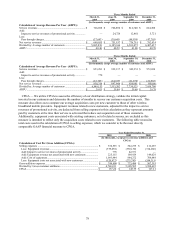
Three Months Ended
March 31,
2010
June 30,
2010
September 30,
2010
December 31,
2010
(In thousands, except average number of customers and ARPU)
Calculation of Avera
g
e Revenue Per User (ARPU):
Service revenues ....................................................................... $ 853,283 $ 922,137 $ 942,251 $ 972,024
Add:
Impact to service revenues of promotional activity ............... 778 — — —
Less:
Pass through charges .............................................................. (23,745) (24,189) (21,270) (21,963)
Net service revenues ................................................................. $ 830,316 $ 897,948 $ 920,981 $ 950,061
Divided by: Average number of customers .............................. 6,949,153 7,513,202 7,734,525 7,958,700
ARPU ....................................................................................... $ 39.83 $ 39.84 $ 39.69 $ 39.79
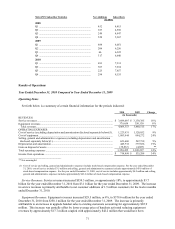
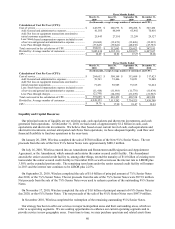
CPGA — We utilize CPGA to assess the efficiency of our distribution strategy, validate the initial capital
invested in our customers and determine the number of months to recover our customer acquisition costs. This
measure also allows us to compare our average acquisition costs per new customer to those of other wireless
broadband mobile providers. Equipment revenues related to new customers, adjusted for the impact to service
revenues of promotional activity, are deducted from selling expenses in this calculation as they represent amounts
paid by customers at the time their service is activated that reduce our acquisition cost of those customers.
Additionally, equipment costs associated with existing customers, net of related revenues, are excluded as this
measure is intended to reflect only the acquisition costs related to new customers. The following table reconciles
total costs used in the calculation of CPGA to selling expenses, which we consider to be the most directly
comparable GAAP financial measure to CPGA.
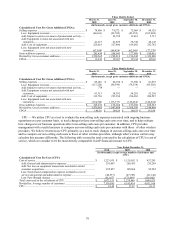
Year Ended December 31,
2010 2009 2008
(In thousands, except gross customer additions and
CPGA)
Calculation of Cost Per Gross Addition (CPGA):
Selling expenses .........................................................................................
.
$ 330,593 $ 302,275 $ 212,293
Less: Equipment revenues .......................................................................
.
(379,658) (350,130) (314,266)
Add: Impact to service revenues of promotional activity ........................
.
778 42,931 —
Add: Equipment revenue not associated with new customers .................
.
225,115 169,929 149,029
Add: Cost of equipment ...........................................................................
.
1,093,944 884,272 704,648
Less: Equipment costs not associated with new customers .....................
.
(520,972) (275,793) (244,311)
Gross addition expenses ..............................................................................
.
$ 749,800 $ 773,484 $ 507,393
Divided by: Gross customer additions ........................................................
.
4,768,011 5,305,505 3,988,692
CPGA .........................................................................................................
.
$ 157.26 $ 145.79 $ 127.21