Metro PCS 2010 Annual Report Download - page 82
Download and view the complete annual report
Please find page 82 of the 2010 Metro PCS annual report below. You can navigate through the pages in the report by either clicking on the pages listed below, or by using the keyword search tool below to find specific information within the annual report.-
 1
1 -
2
-
3
-
4
-
5
-
6
-
7
-
8
-
9
-
10
-
11
-
12
-
13
-
14
-
15
-
16
-
17
-
18
-
19
-
20
-
21
-
22
-
23
-
24
-
25
-
26
-
27
-
28
-
29
-
30
-
31
-
32
-
33
-
34
-
35
-
36
-
37
-
38
-
39
-
40
-
41
-
42
-
43
-
44
-
45
-
46
-
47
-
48
-
49
-
50
-
51
-
52
-
53
-
54
-
55
-
56
-
57
-
58
-
59
-
60
-
61
-
62
-
63
-
64
-
65
-
66
-
67
-
68
-
69
-
70
-
71
-
 72
72 -
 73
73 -
 74
74 -
 75
75 -
 76
76 -
 77
77 -
 78
78 -
 79
79 -
 80
80 -
 81
81 -
 82
82 -
 83
83 -
 84
84 -
 85
85 -
 86
86 -
 87
87 -
 88
88 -
 89
89 -
 90
90 -
 91
91 -
 92
92 -
93
-
94
-
95
-
96
-
97
-
98
-
99
-
100
-
101
-
102
-
103
-
104
-
105
-
106
-
107
-
108
-
109
-
110
-
111
-
112
-
113
-
114
-
115
-
116
-
117
-
118
-
119
-
120
-
121
-
122
-
123
-
124
-
125
-
126
-
127
-
128
-
129
-
130
-
131
-
132
-
133
-
134
-
135
-
136
-
137
-
138
-
139
-
140
-
141
-
142
-
143
-
144
-
145
-
146
-
147
-
148
 |
 |

72
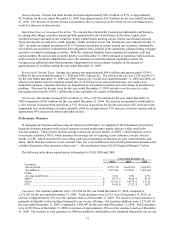
recognized as service revenues but was classified as equipment revenues during the year ended December 31, 2009,
in accordance with ASC 605, because the consideration received from customers was less than the fair value of
promotionally priced handsets.
Cost of Service. Cost of service increased approximately $103.9 million, or 9%, to $1.2 billion for the year ended
December 31, 2010 from $1.1 billion for the year ended December 31, 2009. The increase in cost of service is
primarily attributable to the 23% growth in our customer base and the deployment of additional network
infrastructure, including network infrastructure for 4G LTE, during the twelve months ended December 31, 2010
and costs associated with our unlimited international calling product.
Cost of Equipment. Cost of equipment increased approximately $209.7 million, or approximately 24%, to
approximately $1.1 billion for the year ended December 31, 2010 from approximately $884.3 million for the year
ended December 31, 2009. The increase is primarily attributable to higher upgrade handset costs to existing
customers which led to an approximate $248.2 million increase, partially offset by a decrease in gross customer
additions accounting for an approximate $37.3 million decrease.
Selling, General and Administrative Expenses. Selling, general and administrative expenses increased
approximately $54.0 million, or 9%, to approximately $621.7 million for the year ended December 31, 2010 from
$567.7 million for the year ended December 31, 2009. Selling expenses increased by $28.3 million, or 9%, for the
year ended December 31, 2010 compared to the year ended December 31, 2009. The increase in selling expenses is
primarily attributable to a $37.0 million increase in marketing and advertising expenses as well as a $4.4 million
increase in employee related costs to support our growth. These increases were partially offset by a $13.1 million
decrease in MetroFLASH® expense. General and administrative expenses increased approximately $26.2 million,
or approximately 12%, for the year ended December 31, 2010 as compared to the year ended December 31, 2009
primarily due to the growth in our business.
Depreciation and Amortization. Depreciation and amortization expense increased approximately $71.9 million, or
19%, to $449.7 million for the year ended December 31, 2010 from $377.8 million for the year ended December 31,
2009. The increase related primarily to an increase in network infrastructure assets placed into service during the
twelve months ended December 31, 2010 to support the continued growth and expansion of our network.
Gain on Disposal of Assets. Gain on disposal of assets increased $34.1 million to $38.8 million for the year ended
December 31, 2010 from approximately $4.7 million for the year ended December 31, 2009. The increase in the
gain on disposal of assets was primarily due to spectrum exchange agreements consummated during the year ended
December 31, 2010, partially offset by a loss on disposal of assets related to certain network technology that was
retired and replaced with newer technology during the year ended December 31, 2010.
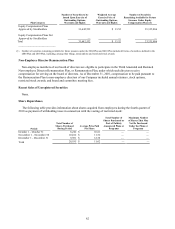
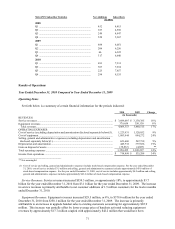
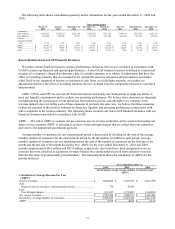
Non-Operating Items
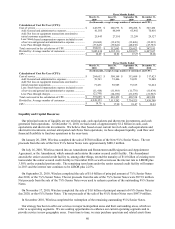
2010 2009 Change
(in thousands)
Interest expense ...........................................................................................................................
.
$ 263,125 $ 270,285 (3)%
Loss on extinguishment of debt ...................................................................................................
.
143,626
—
100%
Provision for income taxes...........................................................................................................
.
118,879 86,835 37%
Net income ...................................................................................................................................
.
193,415 176,844 9%
Interest Expense. Interest expense decreased approximately $7.2 million, or approximately 3%, to $263.1 million
for the year ended December 31, 2010 from approximately $270.3 million for the year ended December 31, 2009.
The decrease in interest expense was primarily attributable to a $28.1 million reduction in interest expense on the
senior secured credit facility as a result of a lower weighted average annual interest rate due to the interest rate
protection agreements that were effective on February 1, 2010, partially offset by a decrease in capitalized interest of
$13.0 million. Our weighted average interest rate decreased to 7.29% for the twelve months ended December 31,
2010 compared to 8.23% for the twelve months ended December 31, 2009. Average debt outstanding for the twelve
months ended December 31, 2010 and 2009 was approximately $3.6 billion and $3.5 billion, respectively.
Loss on Extinguishment of Debt. The loss on extinguishment of debt of $143.6 million for the year ended
December 31, 2010 was due to the redemption of $1.95 billion of outstanding aggregate principal amount of the
9¼% Senior Notes due 2014, or the 9¼% Senior Notes, during the year ended December 31, 2010.