Metro PCS 2010 Annual Report Download - page 89
Download and view the complete annual report
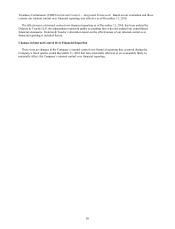
Please find page 89 of the 2010 Metro PCS annual report below. You can navigate through the pages in the report by either clicking on the pages listed below, or by using the keyword search tool below to find specific information within the annual report.-
 1
1 -
2
-
3
-
4
-
5
-
6
-
7
-
8
-
9
-
10
-
11
-
12
-
13
-
14
-
15
-
16
-
17
-
18
-
19
-
20
-
21
-
22
-
23
-
24
-
25
-
26
-
27
-
28
-
29
-
30
-
31
-
32
-
33
-
34
-
35
-
36
-
37
-
38
-
39
-
40
-
41
-
42
-
43
-
44
-
45
-
46
-
47
-
48
-
49
-
50
-
51
-
52
-
53
-
54
-
55
-
56
-
57
-
58
-
59
-
60
-
61
-
62
-
63
-
64
-
65
-
66
-
67
-
68
-
69
-
70
-
71
-
72
-
73
-
74
-
75
-
76
-
77
-
78
-
 79
79 -
 80
80 -
 81
81 -
 82
82 -
 83
83 -
 84
84 -
 85
85 -
 86
86 -
 87
87 -
 88
88 -
 89
89 -
 90
90 -
 91
91 -
 92
92 -
 93
93 -
 94
94 -
 95
95 -
 96
96 -
 97
97 -
 98
98 -
 99
99 -
100
-
101
-
102
-
103
-
104
-
105
-
106
-
107
-
108
-
109
-
110
-
111
-
112
-
113
-
114
-
115
-
116
-
117
-
118
-
119
-
120
-
121
-
122
-
123
-
124
-
125
-
126
-
127
-
128
-
129
-
130
-
131
-
132
-
133
-
134
-
135
-
136
-
137
-
138
-
139
-
140
-
141
-
142
-
143
-
144
-
145
-
146
-
147
-
148
 |
 |

79
Three Months Ended
March 31,
2009
June 30,
2009
September 30,
2009
December 31,
2009
(In thousands, exce
p
t
g
ross customer additions and CPGA)
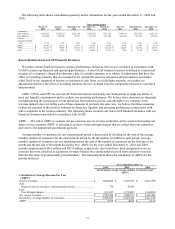
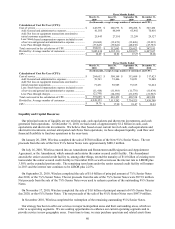
Calculation of Cost Per Gross Addition (CPGA):
Selling expenses ...................................................................... $ 74,906 $ 74,272 $ 72,968 $ 80,129
Less: Equipment revenues .................................................... (68,631) (92,762) (83,253) (105,484)
Add: Impact to service revenues of promotional activity .....
—
24,728 12,481 5,721
Add: Equipment revenue not associated with new
customers ............................................................................ 41,215 41,829 38,742 48,143
Add: Cost of equipment ........................................................ 225,018 227,400 199,092 232,762
Less: Equipment costs not associated with new
customers ............................................................................ (67,058) (69,424) (62,041) (77,270)
Gross addition expenses ........................................................... $ 205,450 $ 206,043 $ 177,989 $ 184,001
Divided by: Gross customer additions ..................................... 1,530,565 1,288,818 1,156,242 1,329,880
CPGA ...................................................................................... $ 134.23 $ 159.87 $ 153.94 $ 138.36
Three Months Ended
March 31,
2010
June 30,
2010
September 30,
2010
December 31,
2010
(In thousands, exce
p
t
g
ross customer additions and CPGA)
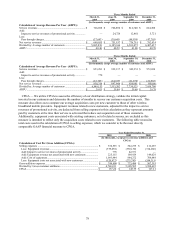
Calculation of Cost Per Gross Addition (CPGA):
Selling expenses ...................................................................... $ 89,146 $ 86,194 $ 73,380 $ 81,872
Less: Equipment revenues .................................................... (117,220) (90,399) (78,538) (93,502)
Add: Impact to service revenues of promotional activity ..... 778
—
—
—
Add: Equipment revenue not associated with new
customers ............................................................................ 63,313 54,392 54,201 53,210
Add: Cost of equipment ........................................................ 313,738 235,354 256,265 288,587
Less: Equipment costs not associated with new
customers ............................................................................ (134,744) (113,377) (128,016) (144,834)
Gross addition expenses ........................................................... $ 215,011 $ 172,164 $ 177,292 $ 185,333
Divided by: Gross customer additions ..................................... 1,470,865 1,047,898 1,104,350 1,144,898
CPGA ...................................................................................... $ 146.18 $ 164.29 $ 160.54 $ 161.88
CPU — We utilize CPU as a tool to evaluate the non-selling cash expenses associated with ongoing business
operations on a per customer basis, to track changes in these non-selling cash costs over time, and to help evaluate
how changes in our business operations affect non-selling cash costs per customer. In addition, CPU provides
management with a useful measure to compare our non-selling cash costs per customer with those of other wireless
providers. We believe investors use CPU primarily as a tool to track changes in our non-selling cash costs over time
and to compare our non-selling cash costs to those of other wireless providers, although other wireless carriers may
calculate this measure differently. The following table reconciles total costs used in the calculation of CPU to cost of
service, which we consider to be the most directly comparable GAAP financial measure to CPU.
Year Ended December 31,
2010 2009 2008
(In thousands, except average number of customers and
CPU)
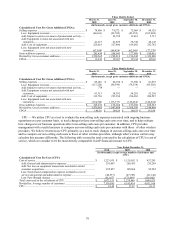
Calculation of Cost Per User (CPU):
Cost of service ........................................................................................ $ 1,223,931 $ 1,120,052 $ 857,295
Add: General and administrative expenses .......................................... 291,067 265,455 235,289
Add: Net loss on equipment transactions unrelated to initial
customer acquisition ............................................................................ 295,857 105,864 95,282
Less: Stoc
k
-
b
ased compensation expense included in cost of
service and general and administrative expense .................................. (46,537) (47,783) (41,142)
Less: Pass through charges .................................................................. (91,167) (173,099) (136,801)
Total costs used in the calculation of CPU ............................................. $ 1,673,151 $ 1,270,489 $ 1,009,923
Divided by: Average number of customers ............................................ 7,538,895 6,145,414 4,631,168
CPU ........................................................................................................ $ 18.49 $ 17.23 $ 18.17