Metro PCS 2010 Annual Report Download - page 126
Download and view the complete annual report
Please find page 126 of the 2010 Metro PCS annual report below. You can navigate through the pages in the report by either clicking on the pages listed below, or by using the keyword search tool below to find specific information within the annual report.-
 1
1 -
2
-
3
-
4
-
5
-
6
-
7
-
8
-
9
-
10
-
11
-
12
-
13
-
14
-
15
-
16
-
17
-
18
-
19
-
20
-
21
-
22
-
23
-
24
-
25
-
26
-
27
-
28
-
29
-
30
-
31
-
32
-
33
-
34
-
35
-
36
-
37
-
38
-
39
-
40
-
41
-
42
-
43
-
44
-
45
-
46
-
47
-
48
-
49
-
50
-
51
-
52
-
53
-
54
-
55
-
56
-
57
-
58
-
59
-
60
-
61
-
62
-
63
-
64
-
65
-
66
-
67
-
68
-
69
-
70
-
71
-
72
-
73
-
74
-
75
-
76
-
77
-
78
-
79
-
80
-
81
-
82
-
83
-
84
-
85
-
86
-
87
-
88
-
89
-
90
-
91
-
92
-
93
-
94
-
95
-
96
-
97
-
98
-
99
-
100
-
101
-
102
-
103
-
104
-
105
-
106
-
107
-
108
-
109
-
110
-
111
-
112
-
113
-
114
-
115
-
 116
116 -
 117
117 -
 118
118 -
 119
119 -
 120
120 -
 121
121 -
 122
122 -
 123
123 -
 124
124 -
 125
125 -
 126
126 -
 127
127 -
 128
128 -
 129
129 -
 130
130 -
 131
131 -
 132
132 -
 133
133 -
 134
134 -
 135
135 -
 136
136 -
137
-
138
-
139
-
140
-
141
-
142
-
143
-
144
-
145
-
146
-
147
-
148
 |
 |

MetroPCS Communications, Inc. and Subsidiaries
Notes to Consolidated Financial Statements
December 31, 2010, 2009 and 2008
F-20
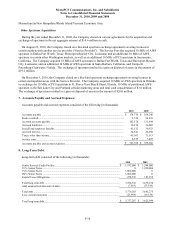
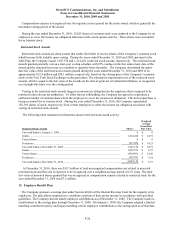
The following table summarizes assets and liabilities measured at fair value on a recurring basis at December 31,
2009, as required by ASC 820 (in thousands):
Fair Value Measurements
Level 1 Level 2 Level 3 Total
Assets
Cash equivalents ........................................................................... $ 910,034 $ 0 $ 0 $ 910,034
Short-term investments ................................................................. 224,932 0 0 224,932
Restricted cash and investments .................................................... 15,438 0 0 15,438
Long-term investments ................................................................. 0 0 6,319 6,319
Total assets measured at fair value ...................................................... $1,150,404 $ 0 $ 6,319 $1,156,723
Liabilities
Derivative liabilities ...................................................................... $ 0 $ 24,859 $ 0 $ 24,859
Total liabilities measured at fair value ................................................. $ 0 $ 24,859 $ 0 $ 24,859
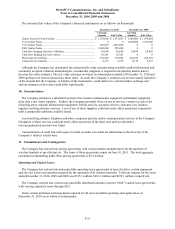
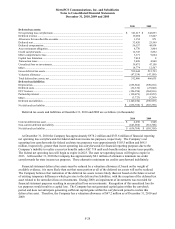
The following table summarizes the changes in fair value of the Company’s net derivative liabilities included in
Level 2 assets (in thousands):
Fair Value Measurements of Net Derivative Liabilities Using Level 2 Inputs Net Derivative Liabilities
2010 2009
Beginning balance .......................................................................................................
.
$ 24,859 $ 54,963
Total losses (realized or unrealized):
Included in earnings (1) ......................................................................................
.
28,696 54,334
Included in accumulated other comprehensive loss............................................
.
(12,146) (24,230)
Transfers in and/or out of Level 2 ......................................................................
.
0 0
Purchases, sales, issuances and settlements ........................................................
.
0 0
Ending balance ............................................................................................................
.
$ 8,309 $ 24,859
_________________
(1) Losses included in earnings that are attributable to the reclassification of the effective portion of those derivative liabilities still held at the
reporting date as reported in interest expense in the consolidated statements of income and comprehensive income.
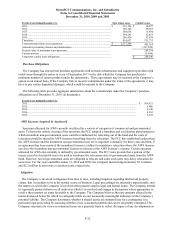
The following table summarizes the changes in fair value of the Company’s Level 3 assets (in thousands):
Fair Value Measurements of Assets Using Level 3 Inputs Long-Term Investments
2010 2009
Beginning balance .........................................................................................................
.
$ 6,319 $ 5,986
Total losses (realized or unrealized):
Included in earnings (2) ........................................................................................
.
0 2,386
Included in accumulated other comprehensive loss..............................................
.
0 (2,719)
Transfers in and/or out of Level 3 ........................................................................
.
0 0
Purchases, sales, issuances and settlements ..........................................................
.
0 0
Ending balance ..............................................................................................................
.
$ 6,319 $ 6,319
_________________
(2) Losses included in earnings that are attributable to the change in unrealized losses relating to those assets still held at the reporting date as
reported in impairment loss on investment securities in the consolidated statements of income and comprehensive income.
The fair value of the Company’s long-term debt is estimated based on the quoted market prices for the same or
similar issues or on the current rates offered to the Company for debt of the same remaining maturities.