Metro PCS 2010 Annual Report Download - page 140
Download and view the complete annual report
Please find page 140 of the 2010 Metro PCS annual report below. You can navigate through the pages in the report by either clicking on the pages listed below, or by using the keyword search tool below to find specific information within the annual report.-
 1
1 -
2
-
3
-
4
-
5
-
6
-
7
-
8
-
9
-
10
-
11
-
12
-
13
-
14
-
15
-
16
-
17
-
18
-
19
-
20
-
21
-
22
-
23
-
24
-
25
-
26
-
27
-
28
-
29
-
30
-
31
-
32
-
33
-
34
-
35
-
36
-
37
-
38
-
39
-
40
-
41
-
42
-
43
-
44
-
45
-
46
-
47
-
48
-
49
-
50
-
51
-
52
-
53
-
54
-
55
-
56
-
57
-
58
-
59
-
60
-
61
-
62
-
63
-
64
-
65
-
66
-
67
-
68
-
69
-
70
-
71
-
72
-
73
-
74
-
75
-
76
-
77
-
78
-
79
-
80
-
81
-
82
-
83
-
84
-
85
-
86
-
87
-
88
-
89
-
90
-
91
-
92
-
93
-
94
-
95
-
96
-
97
-
98
-
99
-
100
-
101
-
102
-
103
-
104
-
105
-
106
-
107
-
108
-
109
-
110
-
111
-
112
-
113
-
114
-
115
-
116
-
117
-
118
-
119
-
120
-
121
-
122
-
123
-
124
-
125
-
126
-
127
-
128
-
129
-
 130
130 -
 131
131 -
 132
132 -
 133
133 -
 134
134 -
 135
135 -
 136
136 -
 137
137 -
 138
138 -
 139
139 -
 140
140 -
 141
141 -
 142
142 -
 143
143 -
 144
144 -
 145
145 -
 146
146 -
 147
147 -
 148
148
 |
 |

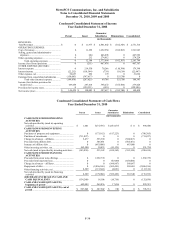
MetroPCS Communications, Inc. and Subsidiaries
Notes to Consolidated Financial Statements
December 31, 2010, 2009 and 2008
F-34
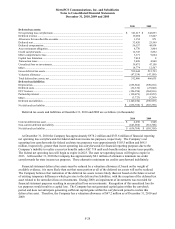
Consolidated Statement of Income
Year Ended December 31, 2008
Parent Issuer
Guarantor
Subsidiaries Eliminations Consolidated
(in thousands)
REVENUES:
Total Revenues .............................................. $ 0 $ 11,977 $ 2,841,842 $ (102,303) $ 2,751,516
OPERATING EXPENSES:
Cost of revenues ............................................ 0 11,292 1,652,954 (102,303) 1,561,943
Selling, general and administrative
expenses ...................................................... 0 684 446,898 0 447,582
Other operating expenses .............................. 0212 274,012 0 274,224
Total operating expenses ..................... 0 12,188 2,373,864 (102,303) 2,283,749
Income (loss) from operations ...................... 0 (211) 467,978 0 467,767
OTHER EXPENSE (INCOME):
Interest expense ............................................. 0 219,530 70,266 (110,398) 179,398
Interest income .............................................. (22,212) (110,394) (739) 110,398 (22,947)
Other expense, net ......................................... 30,857 856 179 0 31,892
Earnings from consolidated subsidiaries ...... (158,083) (397,617) 0555,700 0
Total other (income) expense .............. (149,438) (287,625) 69,706 555,700 188,343
Income (loss) before provision for
income taxes ............................................... 149,438 287,414 398,272 (555,700) 279,424
Provision for income taxes ............................ 0 (129,331) (655) 0 (129,986)
Net income (loss) .......................................... $ 149,438 $ 158,083 $ 397,617 $ (555,700) $ 149,438
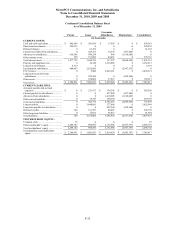
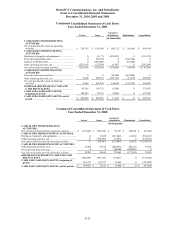
Consolidated Statement of Cash Flows
Year Ended December 31, 2010
Parent Issuer
Guarantor
Subsidiaries Eliminations Consolidated
(in thousands)
CASH FLOWS FROM OPERATING
ACTIVITIES:
Net cash provided by (used in) operating
activities ................................................................... $ 1,401 $(37,976) $1,031,075 $ 0 $ 994,500
CASH FLOWS FROM INVESTING
ACTIVITIES:
Purchases of property and equipment ........................ 0 (173,162) (617,223) 0 (790,385)
Purchase of investments ............................................. (711,827) 0 0 0 (711,827)
Change in advances
–
affiliates .................................. 5,477 555,390 0 (560,867) 0
Proceeds from affiliate deb
t
....................................... 0 505,481 0 (505,481) 0
Issuance of affiliate deb
t
............................................ 0 (683,000) 0 683,000 0
Other investing activities, ne
t
..................................... 562,500 30,433 (41,139) 0 551,794
Net cash (used in) provided by investing activities ... (143,850) 235,142 (658,362) (383,348) (950,418)
CASH FLOWS FROM FINANCING
ACTIVITIES:
Proceeds from senior note offerings .......................... 0 1,992,770 0 0 1,992,770
Proceeds from long-term loan .................................... 0 0 683,000 (683,000) 0
Change in advances
–
affiliates .................................. 0 0 (560,867) 560,867 0
Repayment of deb
t
...................................................... 0 (2,056,186) (505,481) 505,481 (2,056,186)
Other financing activities, ne
t
.................................... 8,209 (115,644) (6,081) 0 (113,516)
Net cash provided by (used in) financing
activities ................................................................... 8,209 (179,060) (389,429) 383,348 (176,932)
(DECREASE) INCREASE IN CASH AND
CASH EQUIVALENTS ........................................ (134,240) 18,106 (16,716) 0 (132,850)
CASH AND CASH EQUIVALENTS,
be
g
innin
g
of
p
eriod ................................................ 642,089 269,836 17,456 0 929,381
CASH AND CASH EQUIVALENTS, end of
p
eriod ....................................................................... $ 507,849 $ 287,942 $ 740 $ 0 $ 796,531
Condensed
Condensed