Metro PCS 2010 Annual Report Download - page 144
Download and view the complete annual report
Please find page 144 of the 2010 Metro PCS annual report below. You can navigate through the pages in the report by either clicking on the pages listed below, or by using the keyword search tool below to find specific information within the annual report.-
 1
1 -
2
-
3
-
4
-
5
-
6
-
7
-
8
-
9
-
10
-
11
-
12
-
13
-
14
-
15
-
16
-
17
-
18
-
19
-
20
-
21
-
22
-
23
-
24
-
25
-
26
-
27
-
28
-
29
-
30
-
31
-
32
-
33
-
34
-
35
-
36
-
37
-
38
-
39
-
40
-
41
-
42
-
43
-
44
-
45
-
46
-
47
-
48
-
49
-
50
-
51
-
52
-
53
-
54
-
55
-
56
-
57
-
58
-
59
-
60
-
61
-
62
-
63
-
64
-
65
-
66
-
67
-
68
-
69
-
70
-
71
-
72
-
73
-
74
-
75
-
76
-
77
-
78
-
79
-
80
-
81
-
82
-
83
-
84
-
85
-
86
-
87
-
88
-
89
-
90
-
91
-
92
-
93
-
94
-
95
-
96
-
97
-
98
-
99
-
100
-
101
-
102
-
103
-
104
-
105
-
106
-
107
-
108
-
109
-
110
-
111
-
112
-
113
-
114
-
115
-
116
-
117
-
118
-
119
-
120
-
121
-
122
-
123
-
124
-
125
-
126
-
127
-
128
-
129
-
130
-
131
-
132
-
133
-
 134
134 -
 135
135 -
 136
136 -
 137
137 -
 138
138 -
 139
139 -
 140
140 -
 141
141 -
 142
142 -
 143
143 -
 144
144 -
 145
145 -
 146
146 -
 147
147 -
 148
148
 |
 |

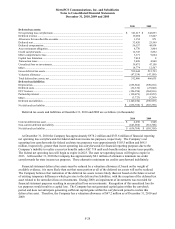
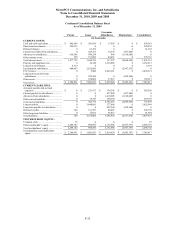
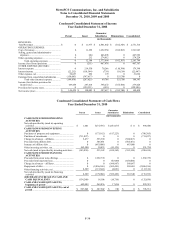
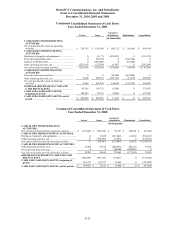
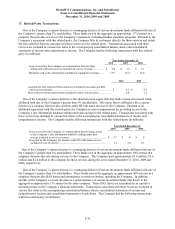
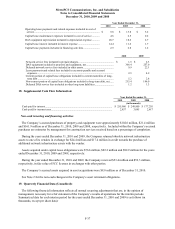
MetroPCS Communications, Inc. and Subsidiaries
Notes to Consolidated Financial Statements
December 31, 2010, 2009 and 2008
F-38
Three Months Ended
March 31,
2010
June 30,
2010
September 30,
2010
December 31,
2010
Total revenues ....................................................................
.
$ 970,503 $ 1,012,536 $ 1,020,789 $ 1,065,525
Income from operations ......................................................
.
105,231 198,412 207,934 207,321
Net income .........................................................................
.
22,661 79,915 77,287 13,552
Net income per common share
—
b
asic .............................
.
$ 0.06 $ 0.22 $ 0.22 $ 0.04
Net income per common share
—
dilute
d
..........................
.
$ 0.06 $ 0.22 $ 0.22 $ 0.04
Three Months Ended
March 31,
2009
June 30,
2009
September 30,
2009
December 31,
2009
Total revenues ....................................................................
.
$ 795,329 $ 859,612 $ 895,593 $ 929,981
Income from operations ......................................................
.
131,487 115,773 158,207 129,821
Net income .........................................................................
.
43,973 26,196 73,550 33,125
Net income per common share
—
b
asic .............................
.
$ 0.12 $ 0.07 $ 0.21 $ 0.10
Net income per common share
—
dilute
d
..........................
.
$ 0.12 $ 0.07 $ 0.21 $ 0.09