Metro PCS 2010 Annual Report Download - page 90
Download and view the complete annual report
Please find page 90 of the 2010 Metro PCS annual report below. You can navigate through the pages in the report by either clicking on the pages listed below, or by using the keyword search tool below to find specific information within the annual report.-
 1
1 -
2
-
3
-
4
-
5
-
6
-
7
-
8
-
9
-
10
-
11
-
12
-
13
-
14
-
15
-
16
-
17
-
18
-
19
-
20
-
21
-
22
-
23
-
24
-
25
-
26
-
27
-
28
-
29
-
30
-
31
-
32
-
33
-
34
-
35
-
36
-
37
-
38
-
39
-
40
-
41
-
42
-
43
-
44
-
45
-
46
-
47
-
48
-
49
-
50
-
51
-
52
-
53
-
54
-
55
-
56
-
57
-
58
-
59
-
60
-
61
-
62
-
63
-
64
-
65
-
66
-
67
-
68
-
69
-
70
-
71
-
72
-
73
-
74
-
75
-
76
-
77
-
78
-
79
-
 80
80 -
 81
81 -
 82
82 -
 83
83 -
 84
84 -
 85
85 -
 86
86 -
 87
87 -
 88
88 -
 89
89 -
 90
90 -
 91
91 -
 92
92 -
 93
93 -
 94
94 -
 95
95 -
 96
96 -
 97
97 -
 98
98 -
 99
99 -
 100
100 -
101
-
102
-
103
-
104
-
105
-
106
-
107
-
108
-
109
-
110
-
111
-
112
-
113
-
114
-
115
-
116
-
117
-
118
-
119
-
120
-
121
-
122
-
123
-
124
-
125
-
126
-
127
-
128
-
129
-
130
-
131
-
132
-
133
-
134
-
135
-
136
-
137
-
138
-
139
-
140
-
141
-
142
-
143
-
144
-
145
-
146
-
147
-
148
 |
 |

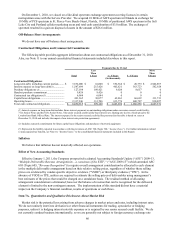
80
Three Months Ended
March 31,
2009
June 30,
2009
September 30,
2009
December 31,
2009
(In thousands, exce
p
t avera
g
e number of customers and CPU)
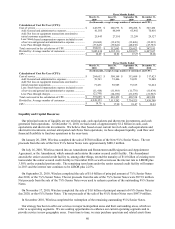
Calculation of Cost Per User (CPU):
Cost of service ......................................................................... $ 245,575 $ 268,733 $ 298,288 $ 307,456
Add: General and administrative expenses ........................... 61,505 68,049 65,492 70,410
Add: Net loss on equipment transactions unrelated to
initial customer acquisition ................................................... 25,843 27,595 23,299 29,127
Less: Stoc
k
-
b
ased compensation expense included in cost
of service and general and administrative expense............... (10,669) (12,673) (12,426) (12,015)
Less: Pass through charges ................................................... (37,643) (39,641) (48,030) (47,785)
Total costs used in the calculation of CPU .............................. $ 284,611 $ 312,063 $ 326,623 $ 347,191
Divided by: Average number of customers ............................. 5,685,830 6,185,116 6,303,075 6,407,637
CPU ......................................................................................... $ 16.69 $ 16.82 $ 17.27 $ 18.06
Three Months Ended
March 31,
2010
June 30,
2010
September 30,
2010
December 31,
2010
(In thousands, exce
p
t avera
g
e number of customers and CPU)
Calculation of Cost Per User (CPU):
Cost of service ......................................................................... $ 284,652 $ 308,168 $ 313,688 $ 317,423
Add: General and administrative expenses ........................... 70,763 72,406 74,051 73,848
Add: Net loss on equipment transactions unrelated to
initial customer acquisition ................................................... 71,431 58,985 73,815 91,624
Less: Stoc
k
-
b
ased compensation expense included in cost
of service and general and administrative expense............... (11,416) (11,918) (11,770) (11,434)
Less: Pass through charges ................................................... (23,745) (24,189) (21,270) (21,963)
Total costs used in the calculation of CPU .............................. $ 391,685 $ 403,452 $ 428,514 $ 449,498
Divided by: Average number of customers ............................. 6,949,153 7,513,202 7,734,525 7,958,700
CPU ......................................................................................... $ 18.79 $ 17.90 $ 18.47 $ 18.83
Liquidity and Capital Resources
Our principal sources of liquidity are our existing cash, cash equivalents and short-term investments, and cash
generated from operations. At December 31, 2010, we had a total of approximately $1.2 billion in cash, cash
equivalents and short-term investments. We believe that, based on our current level of cash, cash equivalents and
short-term investments, and our anticipated cash flows from operations, we have adequate liquidity, cash flow and
financial flexibility to fund our operations in the near-term.
On January 20, 2009, Wireless completed the sale of $550.0 million of the New 9¼% Senior Notes. The net
proceeds from the sale of the New 9¼% Senior Notes were approximately $480.3 million.
On July 16, 2010, Wireless entered into an Amendment and Restatement and Resignation and Appointment
Agreement, or the Amendment, which amends and restates the senior secured credit facility. The Amendment
amends the senior secured credit facility to, among other things, extend the maturity of $1.0 billion of existing term
loans under the senior secured credit facility to November 2016 as well as increase the interest rate to LIBOR plus
3.50% on the extended portion only. The remaining term loans under the senior secured credit facility will mature
in 2013 and the interest rate continues to be LIBOR plus 2.25%.
On September 21, 2010, Wireless completed the sale of $1.0 billion of principal amount of 7Ǭ% Senior Notes
due 2018, or the 7Ǭ% Senior Notes. The net proceeds from the sale of the 7Ǭ% Senior Notes were $973.9 million.
Net proceeds from the sale of the 7Ǭ% Senior Notes were used to redeem a portion of the outstanding 9¼% Senior
Notes.
On November 17, 2010, Wireless completed the sale of $1.0 billion of principal amount of 6ǫ% Senior Notes
due 2020, or the 6ǫ% Senior Notes. The net proceeds of the sale of the 6ǫ% Senior Notes were $987.9 million.
In November 2010, Wireless completed the redemption of the remaining outstanding 9¼% Senior Notes.
Our strategy has been to offer our services in major metropolitan areas and their surrounding areas, which we
refer to as operating segments. We are seeking opportunities to enhance our current operating segments and to
provide service in new geographic areas. From time to time, we may purchase spectrum and related assets from