Metro PCS 2010 Annual Report Download - page 119
Download and view the complete annual report
Please find page 119 of the 2010 Metro PCS annual report below. You can navigate through the pages in the report by either clicking on the pages listed below, or by using the keyword search tool below to find specific information within the annual report.-
 1
1 -
2
-
3
-
4
-
5
-
6
-
7
-
8
-
9
-
10
-
11
-
12
-
13
-
14
-
15
-
16
-
17
-
18
-
19
-
20
-
21
-
22
-
23
-
24
-
25
-
26
-
27
-
28
-
29
-
30
-
31
-
32
-
33
-
34
-
35
-
36
-
37
-
38
-
39
-
40
-
41
-
42
-
43
-
44
-
45
-
46
-
47
-
48
-
49
-
50
-
51
-
52
-
53
-
54
-
55
-
56
-
57
-
58
-
59
-
60
-
61
-
62
-
63
-
64
-
65
-
66
-
67
-
68
-
69
-
70
-
71
-
72
-
73
-
74
-
75
-
76
-
77
-
78
-
79
-
80
-
81
-
82
-
83
-
84
-
85
-
86
-
87
-
88
-
89
-
90
-
91
-
92
-
93
-
94
-
95
-
96
-
97
-
98
-
99
-
100
-
101
-
102
-
103
-
104
-
105
-
106
-
107
-
108
-
 109
109 -
 110
110 -
 111
111 -
 112
112 -
 113
113 -
 114
114 -
 115
115 -
 116
116 -
 117
117 -
 118
118 -
 119
119 -
 120
120 -
 121
121 -
 122
122 -
 123
123 -
 124
124 -
 125
125 -
 126
126 -
 127
127 -
 128
128 -
 129
129 -
130
-
131
-
132
-
133
-
134
-
135
-
136
-
137
-
138
-
139
-
140
-
141
-
142
-
143
-
144
-
145
-
146
-
147
-
148
 |
 |

MetroPCS Communications, Inc. and Subsidiaries
Notes to Consolidated Financial Statements
December 31, 2010, 2009 and 2008
F-13
security based on the contractual participation rights of the security to share in those earnings as if all of the earnings
for the period had been distributed (See Note 15).
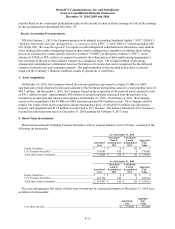
Recent Accounting Pronouncements
Effective January 1, 2011, the Company prospectively adopted Accounting Standards Update (“ASU”) 2009-13,
“Multiple Deliverable Revenue Arrangements – a consensus of the EITF, “ (“ASU 2009-13”) which amended ASC
605 (Topic 605, “Revenue Recognition”) to require overall arrangement consideration be allocated to each element
in the multiple deliverable arrangement based on their relative selling prices, regardless of whether those selling
prices are evidenced by vendor-specific objective evidence (“VSOE”) or third party evidence (“TPE”). In the
absence of VSOE or TPE, entities are required to estimate the selling prices of deliverables using management’s
best estimates of the prices that would be charged on a standalone basis. The residual method of allocating
arrangement consideration is eliminated; however the balance of revenue that can be recognized for the delivered
element is limited to the non-contingent amount. The implementation of this standard did not have a material
impact on the Company’s financial condition, results of operations or cash flows.
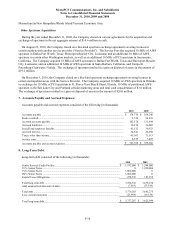
3. Asset Acquisition:
On October 14, 2010, the Company entered into an asset purchase agreement to acquire 10 MHz of AWS
spectrum and certain related network assets adjacent to the Northeast metropolitan areas for a total purchase price of
$49.5 million. On November 1, 2010, the Company closed on the acquisition of the network assets and paid a total
of $41.1 million in cash. Approximately $0.4 million of accrued expenses associated with the purchase were
included in accounts payable and accrued expenses at December 31, 2010. On February 4, 2011, the Company
closed on the acquisition of the 10 MHz of AWS spectrum and paid $8.0 million in cash. The Company used the
relative fair values of the assets acquired to allocate the purchase price, of which $35.6 million was allocated to
property and equipment and $13.9 million was allocated to FCC licenses. The balance allocated to FCC licenses is
recorded in other long-term assets December 31, 2010 pending the February 4, 2011 close.
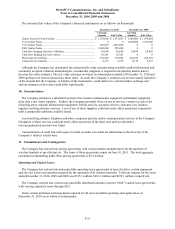
4. Short-Term Investments:
Short-term investments including Treasury Securities, with an original maturity of over 90 days, consisted of the
following (in thousands):
As of December 31, 2010
Amortized
Cost
Unrealized
Gain in
Accumulated
OCI
Unrealized
Loss in
Accumulated
OCI
Aggregate
Fair
Value
Equity Securities .........................................................................
.
$ 7 $ 0 $ (6) $ 1
U.S. Treasury Securities .............................................................
.
374,681 180 0 374,861
Total short-term investments ......................................................
.
$ 374,688 $ 180 $ (6) $ 374,862
As of December 31, 2009
Amortized
Cost
Unrealized
Gain in
Accumulated
OCI
Unrealized
Loss in
Accumulated
OCI
Aggregate
Fair
Value
Equity Securities .........................................................................
.
$ 7 $ 0 $ (5) $ 2
U.S. Treasury Securities .............................................................
.
224,790 140 0 224,930
Total short-term investments ......................................................
.
$ 224,797 $ 140 $ (5) $ 224,932
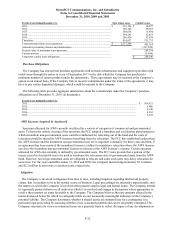
The cost and aggregate fair values of short-term investments by contractual maturity at December 31, 2010 were
as follows (in thousands):
Amortized
Cost
Aggregate
Fair
Value
Less than one yea
r
............................................................................................................... $ 374,681 $ 374,861
at