Metro PCS 2010 Annual Report Download - page 111
Download and view the complete annual report
Please find page 111 of the 2010 Metro PCS annual report below. You can navigate through the pages in the report by either clicking on the pages listed below, or by using the keyword search tool below to find specific information within the annual report.-
 1
1 -
2
-
3
-
4
-
5
-
6
-
7
-
8
-
9
-
10
-
11
-
12
-
13
-
14
-
15
-
16
-
17
-
18
-
19
-
20
-
21
-
22
-
23
-
24
-
25
-
26
-
27
-
28
-
29
-
30
-
31
-
32
-
33
-
34
-
35
-
36
-
37
-
38
-
39
-
40
-
41
-
42
-
43
-
44
-
45
-
46
-
47
-
48
-
49
-
50
-
51
-
52
-
53
-
54
-
55
-
56
-
57
-
58
-
59
-
60
-
61
-
62
-
63
-
64
-
65
-
66
-
67
-
68
-
69
-
70
-
71
-
72
-
73
-
74
-
75
-
76
-
77
-
78
-
79
-
80
-
81
-
82
-
83
-
84
-
85
-
86
-
87
-
88
-
89
-
90
-
91
-
92
-
93
-
94
-
95
-
96
-
97
-
98
-
99
-
100
-
 101
101 -
 102
102 -
 103
103 -
 104
104 -
 105
105 -
 106
106 -
 107
107 -
 108
108 -
 109
109 -
 110
110 -
 111
111 -
 112
112 -
 113
113 -
 114
114 -
 115
115 -
 116
116 -
 117
117 -
 118
118 -
 119
119 -
 120
120 -
 121
121 -
122
-
123
-
124
-
125
-
126
-
127
-
128
-
129
-
130
-
131
-
132
-
133
-
134
-
135
-
136
-
137
-
138
-
139
-
140
-
141
-
142
-
143
-
144
-
145
-
146
-
147
-
148
 |
 |

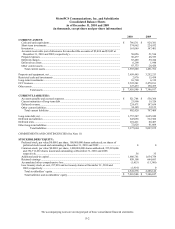
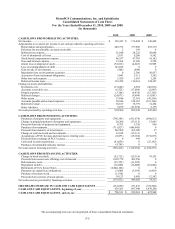
The accompanying notes are an integral part of these consolidated financial statements.
F-5
MetroPCS Communications, Inc. and Subsidiaries
Consolidated Statements of Cash Flows
For the Years Ended December 31, 2010, 2009 and 2008
(in thousands)
2010 2009 2008
CASH FLOWS FROM OPERATING ACTIVITIES:
Net income ............................................................................................................... $ 193,415 $ 176,844 $ 149,438
Adjustments to reconcile net income to net cash provided by operating activities:
Depreciation and amortization ............................................................................. 449,732 377,856 255,319
Provision for uncollectible accounts receivable................................................... 2 199 8
Deferred rent expense .......................................................................................... 21,080 24,222 20,646
Cost of abandoned cell sites ................................................................................. 2,633 8,286 8,592
Stoc
k
-
b
ased compensation expense ..................................................................... 46,537 47,783 41,142
Non-cash interest expense .................................................................................... 13,264 11,309 2,550
(Gain) loss on disposal of assets .......................................................................... (38,812) (4,683) 18,905
Loss on extinguishment of debt ........................................................................... 143,626 0 0
Gain on sale of investments ................................................................................. (566) (644) 0
Impairment loss on investment securities ............................................................ 0 2,386 30,857
Accretion of asset retirement obligations ............................................................. 3,063 5,111 3,542
Other non-cash expense ....................................................................................... 1,929 1,567 1,258
Deferred income taxes ......................................................................................... 115,478 110,161 124,347
Changes in assets and liabilities:
Inventories, net .................................................................................................... (13,648) 8,554 (46,816)
Accounts receivable, net ...................................................................................... (6,523) (17,056) (2,865)
Prepaid expenses .................................................................................................. (3,368) (8,438) (15,102)
Deferred charges .................................................................................................. (24,071) (9,698) (15,081)
Other assets .......................................................................................................... 17,896 23,318 (43,556)
Accounts payable and accrued expenses .............................................................. 30,946 128,167 (119,166)
Deferred revenue ................................................................................................. 36,817 35,779 31,294
Other liabilities .................................................................................................... 5,070 (21,674) 2,178
Net cash provided by operating activities ................................................................ 994,500 899,349 447,490
CASH FLOWS FROM INVESTING ACTIVITIES:
Purchases of property and equipment .................................................................. (790,385) (831,674) (954,612)
Change in prepaid purchases of property and equipment .................................... 28,200 (33,115) 15,645
Proceeds from sale of property and equipment.................................................... 8,793 5,330 856
Purchase of investments ....................................................................................... (711,827) (486,645) 0
Proceeds from maturity of investments ................................................................ 562,500 262,500 37
Change in restricted cash and investments ........................................................... 12,018 (15,113) 0
Acquisitions of FCC licenses and microwave clearing costs ............................... (8,873) (19,186) (331,039)
Proceeds from exchange of FCC licenses ............................................................ 0 949 0
Cash used in asset acquisitions ............................................................................ (41,059) 0 (25,162)
Purchase of redeemable minority interest ............................................................ (9,785) 0 0
Net cash used in investing activities ........................................................................ (950,418) (1,116,954) (1,294,275)
CASH FLOWS FROM FINANCING ACTIVITIES:
Change in book overdraft ..................................................................................... (82,712) (20,314) 79,353
Proceeds from senior note offerings, net of discount........................................... 1,992,770 492,250 0
Debt issuance costs .............................................................................................. (35,353) (11,925) 0
Repayment of debt ............................................................................................... (16,000) (16,000) (16,000)
Retirement of 9¼% Senior Notes ........................................................................ (2,040,186) 0 0
Payments on capital lease obligations .................................................................. (3,660) (3,599) (1,410)
Purchase of treasury stoc
k
................................................................................... (1,914) 0 0
Proceeds from exercise of stock options .............................................................. 10,123 8,626 12,582
Net cash (used in) provided by financing activities ................................................. (176,932) 449,038 74,525
(DECREASE) INCREASE IN CASH AND CASH EQUIVALENTS ............... (132,850) 231,433 (772,260)
CASH AND CASH EQUIVALENTS, be
g
innin
g
of
y
ear ................................... 929,381 697,948 1,470,208
CASH AND CASH EQUIVALENTS, end of year .............................................. $ 796,531 $ 929,381 $ 697,948