Metro PCS 2010 Annual Report Download - page 138
Download and view the complete annual report
Please find page 138 of the 2010 Metro PCS annual report below. You can navigate through the pages in the report by either clicking on the pages listed below, or by using the keyword search tool below to find specific information within the annual report.-
 1
1 -
2
-
3
-
4
-
5
-
6
-
7
-
8
-
9
-
10
-
11
-
12
-
13
-
14
-
15
-
16
-
17
-
18
-
19
-
20
-
21
-
22
-
23
-
24
-
25
-
26
-
27
-
28
-
29
-
30
-
31
-
32
-
33
-
34
-
35
-
36
-
37
-
38
-
39
-
40
-
41
-
42
-
43
-
44
-
45
-
46
-
47
-
48
-
49
-
50
-
51
-
52
-
53
-
54
-
55
-
56
-
57
-
58
-
59
-
60
-
61
-
62
-
63
-
64
-
65
-
66
-
67
-
68
-
69
-
70
-
71
-
72
-
73
-
74
-
75
-
76
-
77
-
78
-
79
-
80
-
81
-
82
-
83
-
84
-
85
-
86
-
87
-
88
-
89
-
90
-
91
-
92
-
93
-
94
-
95
-
96
-
97
-
98
-
99
-
100
-
101
-
102
-
103
-
104
-
105
-
106
-
107
-
108
-
109
-
110
-
111
-
112
-
113
-
114
-
115
-
116
-
117
-
118
-
119
-
120
-
121
-
122
-
123
-
124
-
125
-
126
-
127
-
 128
128 -
 129
129 -
 130
130 -
 131
131 -
 132
132 -
 133
133 -
 134
134 -
 135
135 -
 136
136 -
 137
137 -
 138
138 -
 139
139 -
 140
140 -
 141
141 -
 142
142 -
 143
143 -
 144
144 -
 145
145 -
 146
146 -
 147
147 -
 148
148
 |
 |

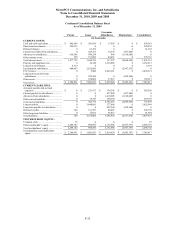
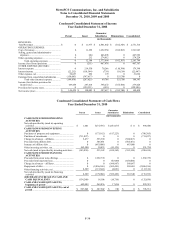
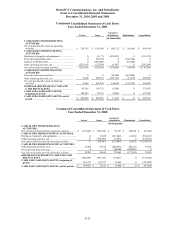
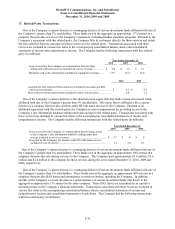
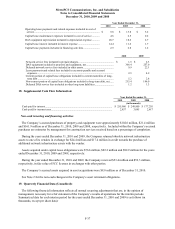
MetroPCS Communications, Inc. and Subsidiaries
Notes to Consolidated Financial Statements
December 31, 2010, 2009 and 2008
F-32
As of December 31, 2009
Parent Issuer
Guarantor
Subsidiaries Eliminations Consolidated
(in thousands)
CURRENT ASSETS:
Cash and cash equivalents ....................... $ 642,089 $ 269,836 $ 17,456 $ 0 $ 929,381
Shor
t
-term investments ............................ 224,932 0 0 0 224,932
Deferred charges ...................................... 0 61,362 0 0 61,362
Current receivable from subsidiaries ....... 0 423,275 14,574 (437,849) 0
Advances to subsidiaries .......................... 610,505 999,234 866 (1,610,605) 0
Other current assets .................................. 199 191,086 84,431 0 275,716
Total current assets .................................. 1,477,725 1,944,793 117,327 (2,048,454) 1,491,391
Property and equipment, ne
t
....................... 0 34,128 3,218,085 0 3,252,213
Long-term investments ............................ 6,319 0 0 0 6,319
Investment in subsidiaries ........................ 804,847 2,162,686 0 (2,967,533) 0
FCC licenses ............................................ 0 3,800 2,466,381 0 2,470,181
Long-term receivable from
subsidiaries ............................................ 0 829,360 0 (829,360) 0
Other assets .............................................. 0 108,086 57,827 0 165,913
Total assets ............................................... $ 2,288,891 $ 5,082,853 $ 5,859,620 $ (5,845,347) $ 7,386,017
CURRENT LIABILITIES:
Accounts payable and accrued
expenses ................................................. $ 0 $ 223,973 $ 334,393 $ 0 $ 558,366
Current payable to subsidiaries ................ 0 0 437,849 (437,849) 0
Advances from subsidiaries ..................... 0 0 1,610,605 (1,610,605) 0
Other current liabilities ............................ 0 78,743 160,360 0 239,103
Total current liabilities ............................. 0 302,716 2,543,207 (2,048,454) 797,469
Long-term debt ......................................... 0 3,448,081 177,868 0 3,625,949
Long-term payable to subsidiaries ........... 0 0 829,360 (829,360) 0
Deferred credits ........................................ 749 511,557 80,487 0 592,793
Other long-term liabilities ........................ 0 15,652 66,012 0 81,664
Total liabilities ......................................... 749 4,278,006 3,696,934 (2,877,814) 5,097,875
STOCKHOLDERS’ EQUITY:
Common stoc
k
......................................... 35 000
35
Other stockholder’s equity ....................... 2,288,107 804,847 2,162,686 (2,967,533) 2,288,107
Total stockholders’ equity ....................... 2,288,142 804,847 2,162,686 (2,967,533) 2,288,142
Total liabilities and stockholders’
equity ..................................................... $ 2,288,891 $ 5,082,853 $ 5,859,620 $ (5,845,347) $ 7,386,017
Condensed Consolidated Balance Sheet