Metro PCS 2010 Annual Report Download - page 81
Download and view the complete annual report
Please find page 81 of the 2010 Metro PCS annual report below. You can navigate through the pages in the report by either clicking on the pages listed below, or by using the keyword search tool below to find specific information within the annual report.-
 1
1 -
2
-
3
-
4
-
5
-
6
-
7
-
8
-
9
-
10
-
11
-
12
-
13
-
14
-
15
-
16
-
17
-
18
-
19
-
20
-
21
-
22
-
23
-
24
-
25
-
26
-
27
-
28
-
29
-
30
-
31
-
32
-
33
-
34
-
35
-
36
-
37
-
38
-
39
-
40
-
41
-
42
-
43
-
44
-
45
-
46
-
47
-
48
-
49
-
50
-
51
-
52
-
53
-
54
-
55
-
56
-
57
-
58
-
59
-
60
-
61
-
62
-
63
-
64
-
65
-
66
-
67
-
68
-
69
-
70
-
 71
71 -
 72
72 -
 73
73 -
 74
74 -
 75
75 -
 76
76 -
 77
77 -
 78
78 -
 79
79 -
 80
80 -
 81
81 -
 82
82 -
 83
83 -
 84
84 -
 85
85 -
 86
86 -
 87
87 -
 88
88 -
 89
89 -
 90
90 -
 91
91 -
92
-
93
-
94
-
95
-
96
-
97
-
98
-
99
-
100
-
101
-
102
-
103
-
104
-
105
-
106
-
107
-
108
-
109
-
110
-
111
-
112
-
113
-
114
-
115
-
116
-
117
-
118
-
119
-
120
-
121
-
122
-
123
-
124
-
125
-
126
-
127
-
128
-
129
-
130
-
131
-
132
-
133
-
134
-
135
-
136
-
137
-
138
-
139
-
140
-
141
-
142
-
143
-
144
-
145
-
146
-
147
-
148
 |
 |

71
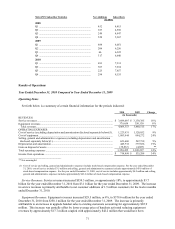
MetroPCS Subscriber Statistics Net Additions Subscribers
(In 000s)
2008
Q1 ............................................................................. 452 4,415
Q2 ............................................................................. 183 4,598
Q3 ............................................................................. 249 4,847
Q4 ............................................................................. 520 5,367
2009
Q1 ............................................................................. 684 6,051
Q2 ............................................................................. 206 6,256
Q3 ............................................................................. 66 6,322
Q4 ............................................................................. 317 6,640
2010
Q1 ............................................................................. 691 7,331
Q2 ............................................................................. 303 7,634
Q3 ............................................................................. 223 7,857
Q4 ............................................................................. 298 8,155
Results of Operations
Year Ended December 31, 2010 Compared to Year Ended December 31, 2009
Operating Items
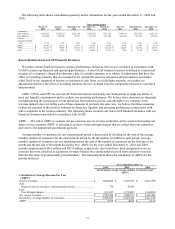
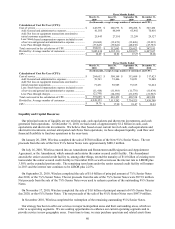
Set forth below is a summary of certain financial information for the periods indicated:
2010
2009 Change
(in thousands)
REVENUES:
Service revenues ................................................................................................................. $ 3,689,695 $ 3,130,385 18%
Equipment revenues ............................................................................................................ 379,658 350,130 8%
Total revenues .................................................................................................................. 4,069,353 3,480,515 17%
OPERATING EXPENSES:
Cost of service (excluding depreciation and amortization disclosed separately
b
elow)(1) . 1,223,931 1,120,052 9%
Cost of equipment ............................................................................................................... 1,093,944 884,272 24%
Selling, general and administrative expenses (excluding depreciation and amortization
disclosed separately below)(1).......................................................................................... 621,660 567,730 9%
Depreciation and amortization ............................................................................................ 449,732 377,856 19%
Gain on disposal of assets ................................................................................................... (38,812) (4,683) **
Total operating expenses .................................................................................................... 3,350,455 2,945,227 14%
Income from operations ...................................................................................................... $ 718,898 $ 535,288 34%
_____________________________
** Not meaningful.
(1) Cost of service and selling, general and administrative expenses include stock-based compensation expense. For the year ended December
31, 2010, cost of service includes $3.5 million and selling, general and administrative expenses includes approximately $43.0 million of
stock-based compensation expense. For the year ended December 31, 2009, cost of service includes approximately $4.2 million and selling,
general and administrative expenses includes approximately $43.6 million of stock-based compensation expense.
Service Revenues. Service revenues increased $559.3 million, or approximately 18%, to approximately $3.7
billion for the year ended December 31, 2010 from $3.1 billion for the year ended December 31, 2009. The increase
in service revenues is primarily attributable to net customer additions of 1.5 million customers for the twelve months
ended December 31, 2010.
Equipment Revenues. Equipment revenues increased $29.5 million, or 8%, to $379.6 million for the year ended
December 31, 2010 from $350.1 million for the year ended December 31, 2009. The increase is primarily
attributable to an increase in upgrade handset sales to existing customers accounting for approximately $85.9
million. This increase was partially offset by lower average price of handsets activated reducing equipment
revenues by approximately $17.7 million coupled with approximately $42.2 million that would have been