Metro PCS 2010 Annual Report Download - page 85
Download and view the complete annual report
Please find page 85 of the 2010 Metro PCS annual report below. You can navigate through the pages in the report by either clicking on the pages listed below, or by using the keyword search tool below to find specific information within the annual report.-
 1
1 -
2
-
3
-
4
-
5
-
6
-
7
-
8
-
9
-
10
-
11
-
12
-
13
-
14
-
15
-
16
-
17
-
18
-
19
-
20
-
21
-
22
-
23
-
24
-
25
-
26
-
27
-
28
-
29
-
30
-
31
-
32
-
33
-
34
-
35
-
36
-
37
-
38
-
39
-
40
-
41
-
42
-
43
-
44
-
45
-
46
-
47
-
48
-
49
-
50
-
51
-
52
-
53
-
54
-
55
-
56
-
57
-
58
-
59
-
60
-
61
-
62
-
63
-
64
-
65
-
66
-
67
-
68
-
69
-
70
-
71
-
72
-
73
-
74
-
 75
75 -
 76
76 -
 77
77 -
 78
78 -
 79
79 -
 80
80 -
 81
81 -
 82
82 -
 83
83 -
 84
84 -
 85
85 -
 86
86 -
 87
87 -
 88
88 -
 89
89 -
 90
90 -
 91
91 -
 92
92 -
 93
93 -
 94
94 -
 95
95 -
96
-
97
-
98
-
99
-
100
-
101
-
102
-
103
-
104
-
105
-
106
-
107
-
108
-
109
-
110
-
111
-
112
-
113
-
114
-
115
-
116
-
117
-
118
-
119
-
120
-
121
-
122
-
123
-
124
-
125
-
126
-
127
-
128
-
129
-
130
-
131
-
132
-
133
-
134
-
135
-
136
-
137
-
138
-
139
-
140
-
141
-
142
-
143
-
144
-
145
-
146
-
147
-
148
 |
 |

75
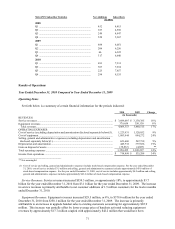
Interest Income. Interest and other income decreased approximately $20.1 million, or 87%, to approximately
$2.9 million for the year ended December 31, 2009 from approximately $23.0 million for the year ended December
31, 2008. The decrease in interest income was primarily due to a decrease on the return on our cash balances as a
result of a decrease in interest rates.
Impairment Loss on Investment Securities. We can and have historically invested our substantial cash balances
in, among other things, securities issued and fully guaranteed by the United States or the states, highly rated
commercial paper and auction rate securities, money market funds meeting certain criteria, and demand deposits.
These investments are subject to credit, liquidity, market and interest rate risk. During the year ended December 31,
2007, we made an original investment of $133.9 million in principal in certain auction rate securities, substantially
all of which are secured by collateralized debt obligations with a portion of the underlying collateral being mortgage
securities or related to mortgage securities. With the continued liquidity issues experienced in global credit and
capital markets, the auction rate securities held by us at December 31, 2009 continued to experience failed auctions
as the amount of securities submitted for sale in the auctions exceeded the amount of purchase orders. We
recognized an additional other-than-temporary impairment loss on investment securities in the amount of
approximately $2.4 million during the year ended December 31, 2009.
Provision for Income Taxes. Income tax expense was approximately $86.8 million and approximately $130.0
million for the year ended December 31, 2009 and 2008, respectively. The effective tax rate was 32.9% and 46.5%
for the year ended December 31, 2009 and 2008, respectively. For the year ended December 31, 2009 and 2008, our
effective rate differs from the statutory federal rate of 35.0% due to net state and local taxes, tax credits, non-
deductible expenses, valuation allowance on impairment on investment securities and a net change in uncertain tax
positions. Provision for income taxes for the year ended December 31, 2009 includes a net decrease in a state
unrecognized tax benefit of $18.1 million due to the expiration of a statute of limitations.
Net Income. Net income increased $27.4 million, or 18%, to $176.8 million for the year ended December 31,
2009 compared to $149.4 million for the year ended December 31, 2008. The increase was primarily attributable to
a 14% increase in income from operations, a 33% decrease in provision for income taxes and a 92% decrease in the
impairment loss on investment securities, partially offset by an approximate 51% increase in interest expense and an
approximate 89% decrease in interest and other income.
Performance Measures
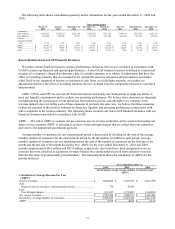
In managing our business and assessing our financial performance, we supplement the information provided by
financial statement measures with several customer-focused performance metrics that are widely used in the
wireless industry. These metrics include average revenue per user per month, or ARPU, which measures service
revenue per customer; CPGA, which measures the average cost of acquiring a new customer; cost per user per
month, or CPU, which measures the non-selling cash cost of operating our business on a per customer basis; and
churn, which measures turnover in our customer base. For a reconciliation of non-GAAP performance measures and
a further discussion of the measures, please read “— Reconciliation of non-GAAP Financial Measures” below.
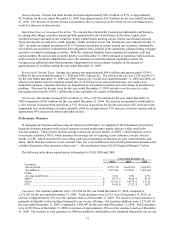
The following table shows annual metric information for 2010, 2009 and 2008.
Year Ended December 31,
2010 2009 2008
Customers:
End of perio
d
............................................................................................
.
8,155,110 6,639,524 5,366,833
Net additions .............................................................................................
.
1,515,586 1,272,691 1,404,047
Churn:
Average monthly rate ................................................................................
.
3.6% 5.5% 4.7%
ARPU ........................................................................................................
.
$ 39.79 $ 40.68 $ 41.39
CPGA ........................................................................................................
.
$ 157.26 $ 145.79 $ 127.21
CPU ...........................................................................................................
.
$ 18.49 $ 17.23 $ 18.17
Customers. Net customer additions were 1,515,586 for the year ended December 31, 2010, compared to
1,272,691 for the year ended December 31, 2009. Total customers were 8,155,110 as of December 31, 2010, an
increase of approximately 23% over the customer total as of December 31, 2009. The increase in total customers is
primarily attributable to the continued demand for our service offerings. Net customer additions were 1,272,691 for
the year ended December 31, 2009, compared to 1,404,047 for the year ended December 31, 2008. Total customers
were 6,639,524 as of December 31, 2009, an increase of approximately 24% over the customer total as of December
31, 2008. The increase in total customers in 2009 was primarily attributable to the continued demand for our service