LensCrafters 2011 Annual Report Download - page 96
Download and view the complete annual report
Please find page 96 of the 2011 LensCrafters annual report below. You can navigate through the pages in the report by either clicking on the pages listed below, or by using the keyword search tool below to find specific information within the annual report.-
 1
1 -
2
-
3
-
4
-
5
-
6
-
7
-
8
-
9
-
10
-
11
-
12
-
13
-
14
-
15
-
16
-
17
-
18
-
19
-
20
-
21
-
22
-
23
-
24
-
25
-
26
-
27
-
28
-
29
-
30
-
31
-
32
-
33
-
34
-
35
-
36
-
37
-
38
-
39
-
40
-
41
-
42
-
43
-
44
-
45
-
46
-
47
-
48
-
49
-
50
-
51
-
52
-
53
-
54
-
55
-
56
-
57
-
58
-
59
-
60
-
61
-
62
-
63
-
64
-
65
-
66
-
67
-
68
-
69
-
70
-
71
-
72
-
73
-
74
-
75
-
76
-
77
-
78
-
79
-
80
-
81
-
82
-
83
-
84
-
85
-
 86
86 -
 87
87 -
 88
88 -
 89
89 -
 90
90 -
 91
91 -
 92
92 -
 93
93 -
 94
94 -
 95
95 -
 96
96 -
 97
97 -
 98
98 -
 99
99 -
 100
100 -
 101
101 -
 102
102 -
 103
103 -
 104
104 -
 105
105 -
 106
106 -
107
-
108
-
109
-
110
-
111
-
112
-
113
-
114
-
115
-
116
-
117
-
118
-
119
-
120
-
121
-
122
-
123
-
124
-
125
-
126
-
127
-
128
-
129
-
130
-
131
-
132
-
133
-
134
-
135
-
136
-
137
-
138
-
139
-
140
-
141
-
142
-
143
-
144
-
145
-
146
-
147
-
148
-
149
-
150
-
151
-
152
-
153
-
154
-
155
-
156
-
157
-
158
-
159
-
160
-
161
-
162
-
163
-
164
-
165
-
166
-
167
-
168
-
169
-
170
-
171
-
172
-
173
-
174
-
175
-
176
-
177
-
178
-
179
-
180
-
181
-
182
-
183
-
184
-
185
-
186
-
187
-
188
-
189
-
190
-
191
-
192
-
193
-
194
-
195
-
196
-
197
-
198
-
199
-
200
-
201
-
202
-
203
-
204
-
205
-
206
-
207
-
208
-
209
-
210
-
211
-
212
-
213
-
214
-
215
-
216
-
217
-
218
-
219
-
220
-
221
-
222
-
223
-
224
-
225
-
226
-
227
-
228
-
229
-
230
-
231
-
232
-
233
-
234
-
235
-
236
-
237
-
238
-
239
-
240
-
241
-
242
-
243
-
244
-
245
-
246
-
247
-
248
-
249
-
250
-
251
-
252
-
253
-
254
-
255
-
256
-
257
-
258
-
259
-
260
-
261
-
262
-
263
-
264
-
265
-
266
-
267
-
268
-
269
-
270
-
271
-
272
-
273
-
274
 |
 |

ANNUAL REPORT 2011> 20 |
percent, to Euro 112.8 million during the three-month period ended December 31, 2011,
from Euro 88.5 million in the same period of 2010. As a percentage of net sales, income
before taxes increased to 7.5 percent during the three-month period ended December 31,
2011, from 6.6 percent in the same period of 2010.
Net income attributable to Luxottica Group stockholders increased by Euro 9.3 million,
or 16.8 percent, to Euro 64.4 million during the three-month period ended December
31, 2011, from Euro 55.1 million in the same period of 2010. Net income attributable to
Luxottica Group stockholders as a percentage of net sales increased to 4.3 percent during
the three-month period ended December 31, 2011, from 4.1 percent in the same period
of 2010. Adjusted net income attributable to Luxottica Group stockholders increased by
Euro 17.1 million, or 30.8 percent, to Euro 72.7 million during the three-month period
ended December 31, 2011, from Euro 55.6 million in the same period of 2010. Adjusted
net income attributable to Luxottica Group stockholders as a percentage of net sales
increased to 4.8 percent during the three-month period ended December 31, 2011, from
4.1 percent in the same period of 2010.
Basic and diluted earnings per share from continuing operations were Euro 0.14 during the
three-month period ended December 31, 2011 as compared to Euro 0.08 in the same period
of 2010. Basic and diluted earnings per share were Euro 0.14 during the three-month period
ended December 31, 2011, compared to Euro 0.12 in the same period of 2010.
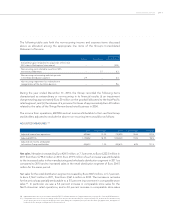
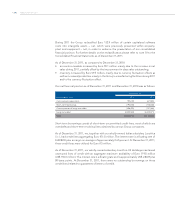
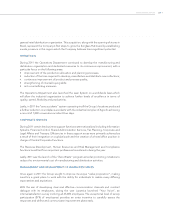
OUR CASH FLOWS
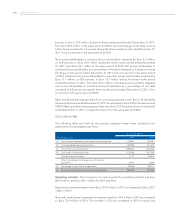
The following table sets forth for the periods indicated certain items included in our
statements of consolidated cash flows:
As of December 31,
(thousands of Euro) 2011 2010
A) Cash and cash equivalents at the beginning of the period 679,852 380,081
B) Cash provided by operating activities 820,896 831,633
C) Cash used in investing activities (459,881) (367,283)
D) Cash used in financing activities (175,018) (167,700)
Change in bank overdrafts 11,173 (18,563)
Effect of exchange rate changes on cash and cash
equivalents 28,078 21,684
E) Net change in cash and cash equivalents 225,248 299,771
F) Cash and cash equivalents at the end of the period 905,100 679,852
Operating activities. The Company’s net cash provided by operating activities was Euro
820.9 million, and Euro 831.6 million for 2011 and 2010.
Depreciation and amortization were Euro 323.9 million in 2011 as compared to Euro 322.1
million in 2010.
Non-cash stock-based compensation expense was Euro 44.5 million in 2011 as compared
to Euro 32.9 million in 2010. The increase in 2011 as compared to 2010 is mainly due