LensCrafters 2011 Annual Report Download - page 222
Download and view the complete annual report
Please find page 222 of the 2011 LensCrafters annual report below. You can navigate through the pages in the report by either clicking on the pages listed below, or by using the keyword search tool below to find specific information within the annual report.-
 1
1 -
2
-
3
-
4
-
5
-
6
-
7
-
8
-
9
-
10
-
11
-
12
-
13
-
14
-
15
-
16
-
17
-
18
-
19
-
20
-
21
-
22
-
23
-
24
-
25
-
26
-
27
-
28
-
29
-
30
-
31
-
32
-
33
-
34
-
35
-
36
-
37
-
38
-
39
-
40
-
41
-
42
-
43
-
44
-
45
-
46
-
47
-
48
-
49
-
50
-
51
-
52
-
53
-
54
-
55
-
56
-
57
-
58
-
59
-
60
-
61
-
62
-
63
-
64
-
65
-
66
-
67
-
68
-
69
-
70
-
71
-
72
-
73
-
74
-
75
-
76
-
77
-
78
-
79
-
80
-
81
-
82
-
83
-
84
-
85
-
86
-
87
-
88
-
89
-
90
-
91
-
92
-
93
-
94
-
95
-
96
-
97
-
98
-
99
-
100
-
101
-
102
-
103
-
104
-
105
-
106
-
107
-
108
-
109
-
110
-
111
-
112
-
113
-
114
-
115
-
116
-
117
-
118
-
119
-
120
-
121
-
122
-
123
-
124
-
125
-
126
-
127
-
128
-
129
-
130
-
131
-
132
-
133
-
134
-
135
-
136
-
137
-
138
-
139
-
140
-
141
-
142
-
143
-
144
-
145
-
146
-
147
-
148
-
149
-
150
-
151
-
152
-
153
-
154
-
155
-
156
-
157
-
158
-
159
-
160
-
161
-
162
-
163
-
164
-
165
-
166
-
167
-
168
-
169
-
170
-
171
-
172
-
173
-
174
-
175
-
176
-
177
-
178
-
179
-
180
-
181
-
182
-
183
-
184
-
185
-
186
-
187
-
188
-
189
-
190
-
191
-
192
-
193
-
194
-
195
-
196
-
197
-
198
-
199
-
200
-
201
-
202
-
203
-
204
-
205
-
206
-
207
-
208
-
209
-
210
-
211
-
 212
212 -
 213
213 -
 214
214 -
 215
215 -
 216
216 -
 217
217 -
 218
218 -
 219
219 -
 220
220 -
 221
221 -
 222
222 -
 223
223 -
 224
224 -
 225
225 -
 226
226 -
 227
227 -
 228
228 -
 229
229 -
 230
230 -
 231
231 -
 232
232 -
233
-
234
-
235
-
236
-
237
-
238
-
239
-
240
-
241
-
242
-
243
-
244
-
245
-
246
-
247
-
248
-
249
-
250
-
251
-
252
-
253
-
254
-
255
-
256
-
257
-
258
-
259
-
260
-
261
-
262
-
263
-
264
-
265
-
266
-
267
-
268
-
269
-
270
-
271
-
272
-
273
-
274
 |
 |

ANNUAL REPORT 2011> 146 |
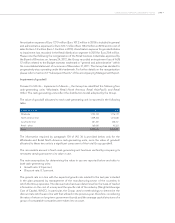
The recoverable amount of cash-generating units has been determined by utilizing post-
tax cash flow forecasts based on the three-year plan for the 2012-2014 period, prepared by
management on the basis of the results attained in previous years as well as management
expectations – split by geographical area – on future trends in the eyewear market for both
the Wholesale and Retail distribution segments. At the end of the cash flow forecasting
period, a terminal value was estimated in order to reflect the value of the cash-generating
unit after the period of the plan. The terminal values were calculated as a perpetuity at
the same growth rate as described above and represent the present value, in the last year
of the forecast, of all future perpetual cash flows. In particular, it should be noted that, in
accordance with the provisions of paragraph 71 of IAS 36, future cash flows of the cash-
generating units in the Retail distribution segment were adjusted in order to reflect the
transfer prices at market conditions. This adjustment was made since the cash generating
units belonging to this segment generate distinct and independent cash flows whose
products are sold within an active market. The impairment test performed as of the balance
sheet date resulted in a recoverable value greater than the carrying amount (net operating
assets) of the abovementioned cash-generating units. No external impairment indicators
were identified which could highlight potential risks of impairment. In percentage terms,
the surplus of the recoverable amount of the cash-generating unit over its carrying amount
was equal to 164 percent and 218 percent of the carrying amount of the Wholesale and
Retail North America cash-generating units, respectively. It should be noted that (i) the
discount rate which makes the recoverable amount of the cash-generating units equal to
their carrying amount is approximately 17 percent for Wholesale and 20 percent for Retail
North America, and (ii) the growth rate which makes the recoverable amount of the cash-
generating units equal to their carrying amounts would be negative.
In addition, any reasonable changes to the abovementioned assumptions used to
determine the recoverable amount (i.e. growth rate changes of +/– 1 percent and
discount rate changes of +/– 0.5 percent) would not significantly affect the impairment
test results.
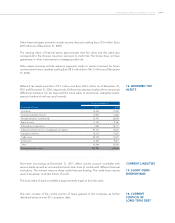
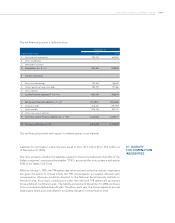
Investments amounted to Euro 8.8 million (Euro 54.1 million as of December 31, 2010).
As described in note 4 “Business Combinations”, the decrease in 2011 as compared to
2010 is mainly related to the acquisition of the remaining 60 percent interest in MOI. As
a result of the acquisition MOI became a fully controlled subsidiary of the Company and,
therefore, has been consolidated line by line starting from the acquisition date. In 2010
MOI was an associate and, therefore, consolidated using the equity method.
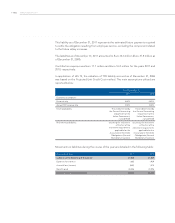
As of December 31
(thousands of Euro) 2011 2010
Other financial assets 50,374 34,014
Other assets 97,251 114,111
Total other non-current assets 147,625 148,125
12. INVESTMENTS
13. OTHER
NON-CURRENT
ASSETS