LensCrafters 2011 Annual Report Download - page 63
Download and view the complete annual report
Please find page 63 of the 2011 LensCrafters annual report below. You can navigate through the pages in the report by either clicking on the pages listed below, or by using the keyword search tool below to find specific information within the annual report.-
 1
1 -
2
-
3
-
4
-
5
-
6
-
7
-
8
-
9
-
10
-
11
-
12
-
13
-
14
-
15
-
16
-
17
-
18
-
19
-
20
-
21
-
22
-
23
-
24
-
25
-
26
-
27
-
28
-
29
-
30
-
31
-
32
-
33
-
34
-
35
-
36
-
37
-
38
-
39
-
40
-
41
-
42
-
43
-
44
-
45
-
46
-
47
-
48
-
49
-
50
-
51
-
52
-
 53
53 -
 54
54 -
 55
55 -
 56
56 -
 57
57 -
 58
58 -
 59
59 -
 60
60 -
 61
61 -
 62
62 -
 63
63 -
 64
64 -
 65
65 -
 66
66 -
 67
67 -
 68
68 -
 69
69 -
 70
70 -
 71
71 -
 72
72 -
 73
73 -
74
-
75
-
76
-
77
-
78
-
79
-
80
-
81
-
82
-
83
-
84
-
85
-
86
-
87
-
88
-
89
-
90
-
91
-
92
-
93
-
94
-
95
-
96
-
97
-
98
-
99
-
100
-
101
-
102
-
103
-
104
-
105
-
106
-
107
-
108
-
109
-
110
-
111
-
112
-
113
-
114
-
115
-
116
-
117
-
118
-
119
-
120
-
121
-
122
-
123
-
124
-
125
-
126
-
127
-
128
-
129
-
130
-
131
-
132
-
133
-
134
-
135
-
136
-
137
-
138
-
139
-
140
-
141
-
142
-
143
-
144
-
145
-
146
-
147
-
148
-
149
-
150
-
151
-
152
-
153
-
154
-
155
-
156
-
157
-
158
-
159
-
160
-
161
-
162
-
163
-
164
-
165
-
166
-
167
-
168
-
169
-
170
-
171
-
172
-
173
-
174
-
175
-
176
-
177
-
178
-
179
-
180
-
181
-
182
-
183
-
184
-
185
-
186
-
187
-
188
-
189
-
190
-
191
-
192
-
193
-
194
-
195
-
196
-
197
-
198
-
199
-
200
-
201
-
202
-
203
-
204
-
205
-
206
-
207
-
208
-
209
-
210
-
211
-
212
-
213
-
214
-
215
-
216
-
217
-
218
-
219
-
220
-
221
-
222
-
223
-
224
-
225
-
226
-
227
-
228
-
229
-
230
-
231
-
232
-
233
-
234
-
235
-
236
-
237
-
238
-
239
-
240
-
241
-
242
-
243
-
244
-
245
-
246
-
247
-
248
-
249
-
250
-
251
-
252
-
253
-
254
-
255
-
256
-
257
-
258
-
259
-
260
-
261
-
262
-
263
-
264
-
265
-
266
-
267
-
268
-
269
-
270
-
271
-
272
-
273
-
274
 |
 |
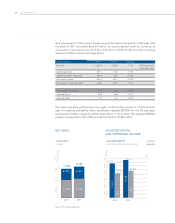
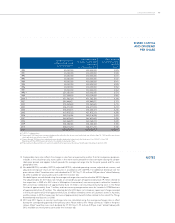
634 GROUP TRENDS IN 2011
See p. 73 for footnote disclosure and information regarding Luxottica’s non-IAS/IFRS reconciliations.
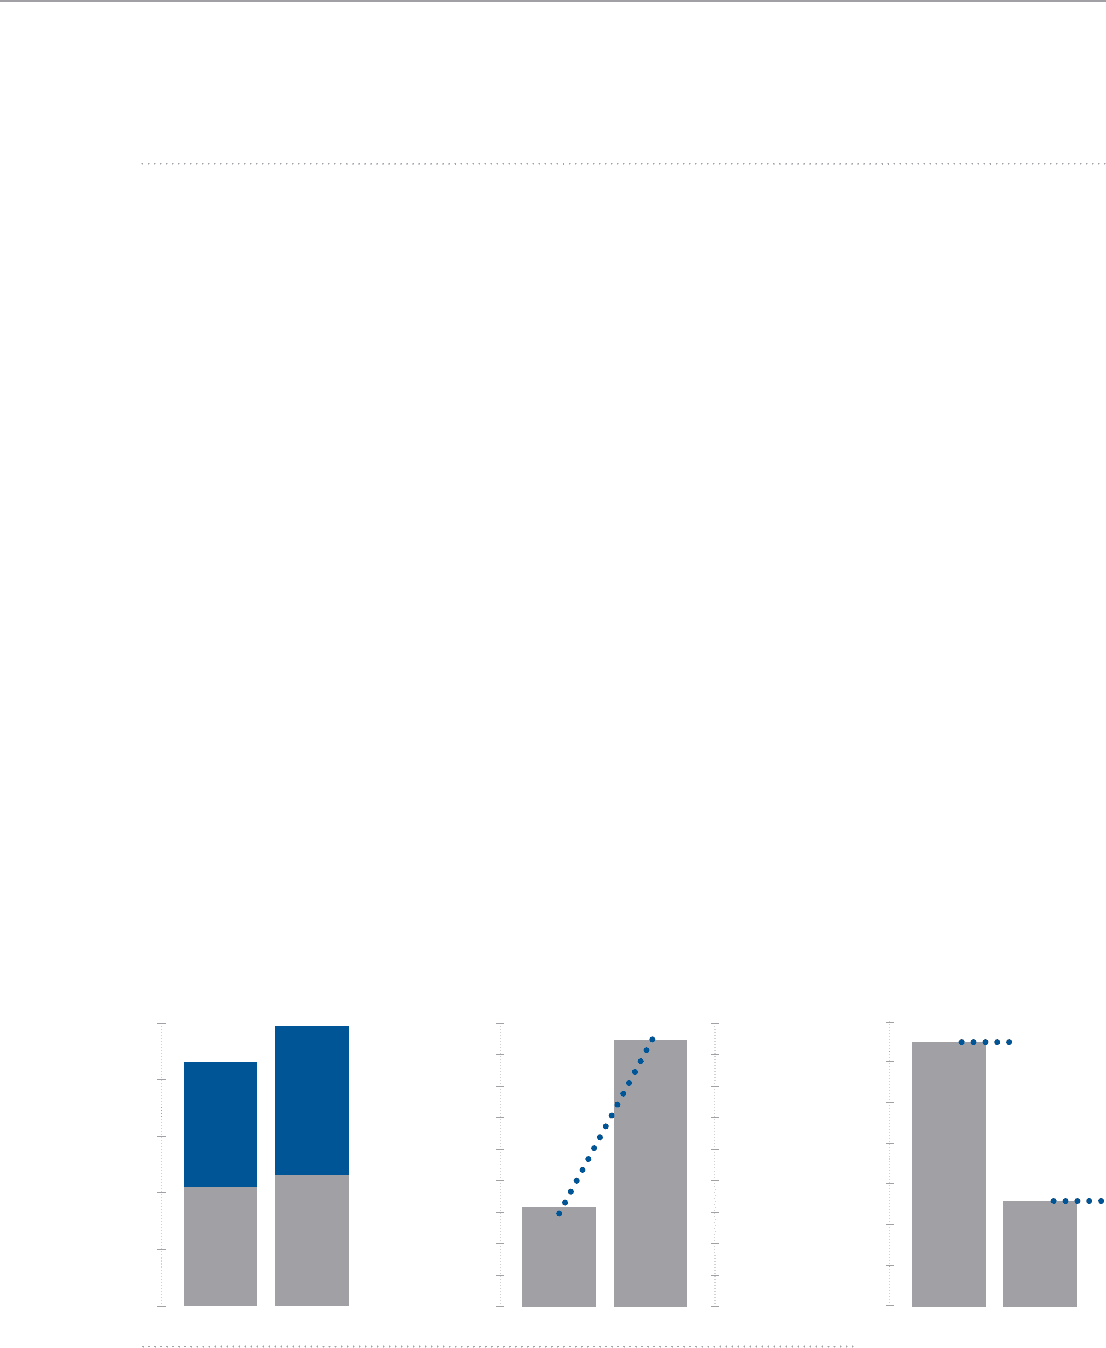
OPERATING INCOME
BY DIVISION
› WHOLESALE
› RETAIL2
424
462
449
529
0 200 400 600 1,000800
2010 2011
(Eur m)
NET INCOME ADJUSTED
AND ADJUSTED EPS
› NET INCOME2
› ADJUSTED EPS2
403
456
370
380
390
400
410
420
430
440
450
460
2010 2011
0.88
0.99
0.82
0.84
0.86
0.88
0.9
0.92
0.94
0.96
0.98
1
(Eur m)
(Eur)
NET DEBT
› NET DEBT2
› ADJUSTED NET DEBT TO EBITDA2
2,111
2,032
2010 2011
1,980
2,000
2,020
2,040
2,060
2,080
2,100
2,120
1.7x
2.0x
(Eur m)
Growth in adjusted operating income2 for 2011, amounting to Euro 820.9 million, was up
12% from the figure recorded at the end of 2010. The Group’s adjusted operating margin
therefore increased from 12.6% for 2010 to 13.2% for 2011, thus confirming the effective-
ness of the measures taken to improve profitability.
Operating income of the Wholesale Division in 2011 amounted to Euro 529.1 million
(+14.6% over 2010), with an operating margin of 21.5% (+80 bps as compared with the
previous year).
In 2011 the Retail Division recorded adjusted operating income2 of Euro 448.7 million, up
5.7% from 2010, with an adjusted operating margin2 of 11.9%, in line with the previous year.
Adjusted net income attributable to Luxottica Group Stockholders2 for the year amounted
to Euro 455.6 million, up 13.1% from Euro 402.7 million for last year, corresponding to ad-
justed Earnings per Share (EPS)2 of Euro 0.99.
By carefully controlling working capital, the Group generated strong free cash flow, reach-
ing approximately Euro 500 million during the year. As a result, net debt2 as of December
31, 2011 decreased further, falling to Euro 2,032 million (Euro 2,111 million at the end of
2010), and the ratio of adjusted net debt to EBITDA2 was 1.7x, as compared with the 2.0x
at the end of 2010. For 2012, a further decrease in financial leverage is expected.