LensCrafters 2011 Annual Report Download - page 89
Download and view the complete annual report
Please find page 89 of the 2011 LensCrafters annual report below. You can navigate through the pages in the report by either clicking on the pages listed below, or by using the keyword search tool below to find specific information within the annual report.-
 1
1 -
2
-
3
-
4
-
5
-
6
-
7
-
8
-
9
-
10
-
11
-
12
-
13
-
14
-
15
-
16
-
17
-
18
-
19
-
20
-
21
-
22
-
23
-
24
-
25
-
26
-
27
-
28
-
29
-
30
-
31
-
32
-
33
-
34
-
35
-
36
-
37
-
38
-
39
-
40
-
41
-
42
-
43
-
44
-
45
-
46
-
47
-
48
-
49
-
50
-
51
-
52
-
53
-
54
-
55
-
56
-
57
-
58
-
59
-
60
-
61
-
62
-
63
-
64
-
65
-
66
-
67
-
68
-
69
-
70
-
71
-
72
-
73
-
74
-
75
-
76
-
77
-
78
-
 79
79 -
 80
80 -
 81
81 -
 82
82 -
 83
83 -
 84
84 -
 85
85 -
 86
86 -
 87
87 -
 88
88 -
 89
89 -
 90
90 -
 91
91 -
 92
92 -
 93
93 -
 94
94 -
 95
95 -
 96
96 -
 97
97 -
 98
98 -
 99
99 -
100
-
101
-
102
-
103
-
104
-
105
-
106
-
107
-
108
-
109
-
110
-
111
-
112
-
113
-
114
-
115
-
116
-
117
-
118
-
119
-
120
-
121
-
122
-
123
-
124
-
125
-
126
-
127
-
128
-
129
-
130
-
131
-
132
-
133
-
134
-
135
-
136
-
137
-
138
-
139
-
140
-
141
-
142
-
143
-
144
-
145
-
146
-
147
-
148
-
149
-
150
-
151
-
152
-
153
-
154
-
155
-
156
-
157
-
158
-
159
-
160
-
161
-
162
-
163
-
164
-
165
-
166
-
167
-
168
-
169
-
170
-
171
-
172
-
173
-
174
-
175
-
176
-
177
-
178
-
179
-
180
-
181
-
182
-
183
-
184
-
185
-
186
-
187
-
188
-
189
-
190
-
191
-
192
-
193
-
194
-
195
-
196
-
197
-
198
-
199
-
200
-
201
-
202
-
203
-
204
-
205
-
206
-
207
-
208
-
209
-
210
-
211
-
212
-
213
-
214
-
215
-
216
-
217
-
218
-
219
-
220
-
221
-
222
-
223
-
224
-
225
-
226
-
227
-
228
-
229
-
230
-
231
-
232
-
233
-
234
-
235
-
236
-
237
-
238
-
239
-
240
-
241
-
242
-
243
-
244
-
245
-
246
-
247
-
248
-
249
-
250
-
251
-
252
-
253
-
254
-
255
-
256
-
257
-
258
-
259
-
260
-
261
-
262
-
263
-
264
-
265
-
266
-
267
-
268
-
269
-
270
-
271
-
272
-
273
-
274
 |
 |

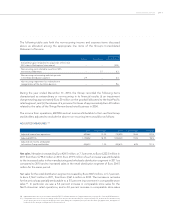
| 13 >MANAGEMENT REPORT
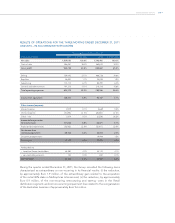
Cost of sales. Cost of sales increased by Euro 177.9 million, or 8.9 percent, to Euro 2,168.1
million in 2011 from Euro 1,990.2 million in 2010, essentially in line with the increase of net
sales in the period. As a percentage of net sales, cost of sales was at 34.8 percent and 34.3
percent in 2011 and 2010, respectively. In 2011, the average number of frames produced
daily in our facilities increased to approximately 263,300 as compared to approximately
235,000 in 2010, which was attributable to increased production in all manufacturing
facilities in response to an overall increase in demand.
Gross profit. Our gross profit increased by Euro 246.6 million, or 6.5 percent, to
Euro 4,054.4 million in 2011 from Euro 3,807.8 million in 2010. As a percentage of net sales,
gross profit was at 65.2 percent and 65.7 percent in 2011 and 2010, respectively, due to the
factors noted above.
Operating expenses. Total operating expenses increased by Euro 151.6 million, or 4.9
percent, to Euro 3,247.3 million in 2011 from Euro 3,095.7 million in 2010, in line with the
increase of net sales in the period. As a percentage of net sales, operating expenses
decreased to 52.2 percent in 2011 from 53.4 percent in 2010. Total adjusted operating
expenses, excluding the above mentioned non-recurring items, increased by Euro 158.3
million, or 5.1 percent, to Euro 3,233.6 million in 2011 from Euro 3,075.2 million in 2010, but
as a percentage of net sales, adjusted operating expenses decreased to 52.0 percent in
2011 from 53.0 percent in 2010.
Selling and advertising expenses (including royalty expenses) increased by Euro 141.8
million, or 6.0 percent, to Euro 2,509.8 million in 2011 from Euro 2,368.0 million in 2010.
Selling expenses increased by Euro 98.5 million, or 5.2 percent. Advertising expenses
increased by Euro 36.6 million, or 9.9 percent. Royalties increased by Euro 6.7 million, or
6.7 percent. As a percentage of net sales, selling and advertising expenses decreased to
40.3 percent in 2011, compared to 40.8 percent in 2010, mainly due to the increase in net
sales in relation to the fixed portion of selling expenses, such as occupancy costs.
Adjusted selling and advertising expenses (including royalty expenses), excluding the
above mentioned non-recurring items, increased by Euro 133.2 million, or 5.6 percent, to
Euro 2,501.2 million in 2011 from Euro 2,368.0 million in 2010. Adjusted selling expenses
increased by Euro 95.6 million, or 5.0 percent. Adjusted advertising expenses increased
by Euro 30.9 million, or 8.3 percent. As a percentage of net sales, adjusted selling and
advertising expenses decreased to 40.2 percent in 2011, compared to 40.8 percent in 2010.
General and administrative expenses, including intangible asset amortization, increased
by Euro 9.8 million, or 1.3 percent, to Euro 737.5 million in 2011 as compared to Euro727.7
million in 2010. As a percentage of net sales, general and administrative expenses
decreased to 11.9 percent in 2011, compared to 12.6 percent in 2010.
Adjusted general and administrative expenses, including intangible asset amortization,
and excluding the above mentioned non-recurring items increased by Euro 25.1 million,
or 3.5 percent, to Euro 732.3 million in 2011 as compared to Euro 707.3 million in 2010. As
a percentage of net sales, adjusted general and administrative expenses adjusted for the
non-recurring items mentioned above decreased to 11.8 percent in 2011, compared to
12.2 percent in 2010.