LensCrafters 2011 Annual Report Download - page 220
Download and view the complete annual report
Please find page 220 of the 2011 LensCrafters annual report below. You can navigate through the pages in the report by either clicking on the pages listed below, or by using the keyword search tool below to find specific information within the annual report.-
 1
1 -
2
-
3
-
4
-
5
-
6
-
7
-
8
-
9
-
10
-
11
-
12
-
13
-
14
-
15
-
16
-
17
-
18
-
19
-
20
-
21
-
22
-
23
-
24
-
25
-
26
-
27
-
28
-
29
-
30
-
31
-
32
-
33
-
34
-
35
-
36
-
37
-
38
-
39
-
40
-
41
-
42
-
43
-
44
-
45
-
46
-
47
-
48
-
49
-
50
-
51
-
52
-
53
-
54
-
55
-
56
-
57
-
58
-
59
-
60
-
61
-
62
-
63
-
64
-
65
-
66
-
67
-
68
-
69
-
70
-
71
-
72
-
73
-
74
-
75
-
76
-
77
-
78
-
79
-
80
-
81
-
82
-
83
-
84
-
85
-
86
-
87
-
88
-
89
-
90
-
91
-
92
-
93
-
94
-
95
-
96
-
97
-
98
-
99
-
100
-
101
-
102
-
103
-
104
-
105
-
106
-
107
-
108
-
109
-
110
-
111
-
112
-
113
-
114
-
115
-
116
-
117
-
118
-
119
-
120
-
121
-
122
-
123
-
124
-
125
-
126
-
127
-
128
-
129
-
130
-
131
-
132
-
133
-
134
-
135
-
136
-
137
-
138
-
139
-
140
-
141
-
142
-
143
-
144
-
145
-
146
-
147
-
148
-
149
-
150
-
151
-
152
-
153
-
154
-
155
-
156
-
157
-
158
-
159
-
160
-
161
-
162
-
163
-
164
-
165
-
166
-
167
-
168
-
169
-
170
-
171
-
172
-
173
-
174
-
175
-
176
-
177
-
178
-
179
-
180
-
181
-
182
-
183
-
184
-
185
-
186
-
187
-
188
-
189
-
190
-
191
-
192
-
193
-
194
-
195
-
196
-
197
-
198
-
199
-
200
-
201
-
202
-
203
-
204
-
205
-
206
-
207
-
208
-
209
-
 210
210 -
 211
211 -
 212
212 -
 213
213 -
 214
214 -
 215
215 -
 216
216 -
 217
217 -
 218
218 -
 219
219 -
 220
220 -
 221
221 -
 222
222 -
 223
223 -
 224
224 -
 225
225 -
 226
226 -
 227
227 -
 228
228 -
 229
229 -
 230
230 -
231
-
232
-
233
-
234
-
235
-
236
-
237
-
238
-
239
-
240
-
241
-
242
-
243
-
244
-
245
-
246
-
247
-
248
-
249
-
250
-
251
-
252
-
253
-
254
-
255
-
256
-
257
-
258
-
259
-
260
-
261
-
262
-
263
-
264
-
265
-
266
-
267
-
268
-
269
-
270
-
271
-
272
-
273
-
274
 |
 |

ANNUAL REPORT 2011> 144 |
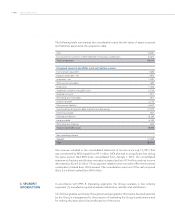
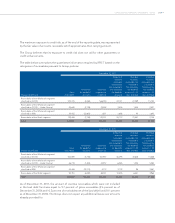
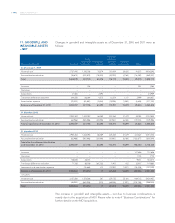
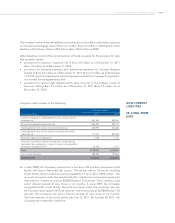
Changes in goodwill and intangible assets as of December 31, 2010 and 2011 were as
follows:
(thousands of Euro)0 Goodwill
Trade
names and
trademarks
Distribution
network
Customer
relations,
contracts
and lists
Franchise
agreements Other Total
As of January 1, 2009
Historical cost 2,727,445 1,330,308 78,279 210,509 20,025 41,675 4,408,242
Accumulated amortization (38,610) (457,603) (18,003) (34,390) (4,760) (16,160) (569,527)
Total 2,688,835 872,705 60,276 176,119 15,265 25,515 3,838,715
Increases – 308 – – – 957 1,265
Decreases –––––––
Acquisitions 21,465 – 2,494 – – – 23,959
Translation difference and other 200,528 66,064 4,375 12,574 1,117 3,999 288,657
Amortization expense (20,432) (61,881) (3,854) (15,296) (1,082) (4,646) (107,192)
Balance as of December 31, 2010 2,890,397 877,196 63,290 173,397 15,299 25,824 4,045,404
31 dicembre 2010
Historical cost 2,953,383 1,423,092 86,389 225,364 21,479 45,094 4,754,800
Accumulated amortization (62,986) (545,896) (23,098) (51,967) (6,180) (19,270) (709,396)
Total as reported as of December 31, 2010 2,890,397 877,196 63,290 173,397 15,299 25,824 4,045,404
31 dicembre 2010
Historical cost 2,953,383 1,423,092 86,389 225,364 21,479 321,627 5,031,334
Accumulated amortization (62,986) (545,896) (23,098) (51,967) (6,180) (162,877) (853,004)
Total after the software riclassification
as of December 31, 2010 2,890,397 877,196 63,290 173,397 15,299 158,750 4,178,330
Increases –––––107,646 107,646
Decreases –––––(710) (710)
Acquisitions 128,808 26,014 – – – 9,451 164,273
Translation difference and other 71,358 86,506 (63,232) 1,903 422 22,927 119,885
Impairment and amortization expense – (74,666) (41) (14,093) (1,031) (38,108) (127,939)
Balance as of December 31, 2011 3,090,563 915,050 17 161,208 14,690 259,956 4,441,484
Of which:
Historical cost 3,137,506 1.576.008 287 229.733 22.181 464.712 5.430.427
Accumulated amortization (46,943) (660.958) (270) (68.526) (7.491) (204.756) (988.943)
Total 3,090,563 915,050 17 161,208 14,690 259,956 4,441,484
The increase in goodwill and intangible assets – net due to business combinations is
mainly due to the acquisition of MOI. Please refer to note 4 “Business Combinations” for
further details on the MOI acquisition.
11. GOODWILL AND
INTANGIBLE ASSETS
– NET