LensCrafters 2011 Annual Report Download - page 206
Download and view the complete annual report
Please find page 206 of the 2011 LensCrafters annual report below. You can navigate through the pages in the report by either clicking on the pages listed below, or by using the keyword search tool below to find specific information within the annual report.-
 1
1 -
2
-
3
-
4
-
5
-
6
-
7
-
8
-
9
-
10
-
11
-
12
-
13
-
14
-
15
-
16
-
17
-
18
-
19
-
20
-
21
-
22
-
23
-
24
-
25
-
26
-
27
-
28
-
29
-
30
-
31
-
32
-
33
-
34
-
35
-
36
-
37
-
38
-
39
-
40
-
41
-
42
-
43
-
44
-
45
-
46
-
47
-
48
-
49
-
50
-
51
-
52
-
53
-
54
-
55
-
56
-
57
-
58
-
59
-
60
-
61
-
62
-
63
-
64
-
65
-
66
-
67
-
68
-
69
-
70
-
71
-
72
-
73
-
74
-
75
-
76
-
77
-
78
-
79
-
80
-
81
-
82
-
83
-
84
-
85
-
86
-
87
-
88
-
89
-
90
-
91
-
92
-
93
-
94
-
95
-
96
-
97
-
98
-
99
-
100
-
101
-
102
-
103
-
104
-
105
-
106
-
107
-
108
-
109
-
110
-
111
-
112
-
113
-
114
-
115
-
116
-
117
-
118
-
119
-
120
-
121
-
122
-
123
-
124
-
125
-
126
-
127
-
128
-
129
-
130
-
131
-
132
-
133
-
134
-
135
-
136
-
137
-
138
-
139
-
140
-
141
-
142
-
143
-
144
-
145
-
146
-
147
-
148
-
149
-
150
-
151
-
152
-
153
-
154
-
155
-
156
-
157
-
158
-
159
-
160
-
161
-
162
-
163
-
164
-
165
-
166
-
167
-
168
-
169
-
170
-
171
-
172
-
173
-
174
-
175
-
176
-
177
-
178
-
179
-
180
-
181
-
182
-
183
-
184
-
185
-
186
-
187
-
188
-
189
-
190
-
191
-
192
-
193
-
194
-
195
-
 196
196 -
 197
197 -
 198
198 -
 199
199 -
 200
200 -
 201
201 -
 202
202 -
 203
203 -
 204
204 -
 205
205 -
 206
206 -
 207
207 -
 208
208 -
 209
209 -
 210
210 -
 211
211 -
 212
212 -
 213
213 -
 214
214 -
 215
215 -
 216
216 -
217
-
218
-
219
-
220
-
221
-
222
-
223
-
224
-
225
-
226
-
227
-
228
-
229
-
230
-
231
-
232
-
233
-
234
-
235
-
236
-
237
-
238
-
239
-
240
-
241
-
242
-
243
-
244
-
245
-
246
-
247
-
248
-
249
-
250
-
251
-
252
-
253
-
254
-
255
-
256
-
257
-
258
-
259
-
260
-
261
-
262
-
263
-
264
-
265
-
266
-
267
-
268
-
269
-
270
-
271
-
272
-
273
-
274
 |
 |
ANNUAL REPORT 2011> 130 |
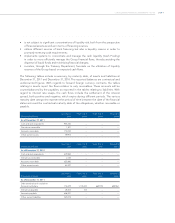
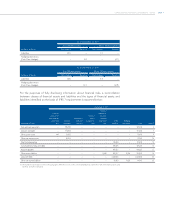
(thousands of Euro)
Less than 1
year
From 1 to 3
years
From 3 to 5
years
Beyond 5
years
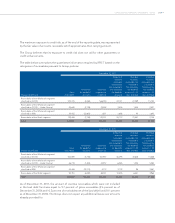
As of December 31, 2010
Debt owed to banks and other
financial institutions 428,385 1,321,627 959,664 374,975
Derivatives payable 44,951 20,505 – –
Accounts payable 537,742 – – –
Other current liabilities 440,590 – – –
(e) Interest rate risk
The interest rate risk to which the Group is exposed primarily originates from long-term
debt. Such debt accrues interest at both fixed and floating rates.
With regard to the risk arising from fixed-rate debt, the Group does not apply specific
hedging policies since it does not deem the risk to be material.
Floating-rate debt exposes the Group to a risk from the volatility of the interest rates
(cash flow risk). In relation to this risk, and for the purposes of the related hedging, the
Group utilizes derivate contracts, specifically Interest Rate Swap (IRS) agreements, which
exchange the floating rate for a fixed rate, thereby reducing the risk from interest rate
volatility.
The risk policy of the Group requires the maintenance of a percentage of fixed-rate debts
that is greater than 25 percent and less than 75 percent of total debt. This percentage is
obtained by utilizing Interest Rate Swap agreements, where required.
On the basis of various scenarios, the Group calculates the impact of rate changes
on the consolidated statement of income. For each scenario, the same interest rate
change is utilized for all currencies. The various scenarios only include those liabilities at
floating rates that are not hedged with fixed interest rate swaps. On the basis of these
scenarios, the impact as of December 31, 2011 and net of tax effect, of an increase/
decrease of 100 basis points on net income, in a situation with all other variables
unchanged, would have been a maximum decrease of Euro 3.1 million (Euro 4.4 million
as of December 31, 2010) or a maximum increase of Euro 3.1 million (Euro 4.4 million as
of December 31, 2010).
With reference to Interest Rate Swap agreements utilized to hedge against cash flow risk
as of December 31, 2011, and in the event that interest rates increased/decreased by 100
basis points, with all other variables unchanged, the stockholders’ equity reserves would
have been, respectively, greater by Euro 4.0 million (Euro 12.7 million as of December 31,
2010), net of tax effect, and lower by Euro 4.1 million (Euro 12.9 million as of December 31,
2010), net of tax effect, in connection with the increase/decrease of the fair value of the
derivatives used for the cash flow hedges.