LensCrafters 2011 Annual Report Download - page 88
Download and view the complete annual report
Please find page 88 of the 2011 LensCrafters annual report below. You can navigate through the pages in the report by either clicking on the pages listed below, or by using the keyword search tool below to find specific information within the annual report.-
 1
1 -
2
-
3
-
4
-
5
-
6
-
7
-
8
-
9
-
10
-
11
-
12
-
13
-
14
-
15
-
16
-
17
-
18
-
19
-
20
-
21
-
22
-
23
-
24
-
25
-
26
-
27
-
28
-
29
-
30
-
31
-
32
-
33
-
34
-
35
-
36
-
37
-
38
-
39
-
40
-
41
-
42
-
43
-
44
-
45
-
46
-
47
-
48
-
49
-
50
-
51
-
52
-
53
-
54
-
55
-
56
-
57
-
58
-
59
-
60
-
61
-
62
-
63
-
64
-
65
-
66
-
67
-
68
-
69
-
70
-
71
-
72
-
73
-
74
-
75
-
76
-
77
-
 78
78 -
 79
79 -
 80
80 -
 81
81 -
 82
82 -
 83
83 -
 84
84 -
 85
85 -
 86
86 -
 87
87 -
 88
88 -
 89
89 -
 90
90 -
 91
91 -
 92
92 -
 93
93 -
 94
94 -
 95
95 -
 96
96 -
 97
97 -
 98
98 -
99
-
100
-
101
-
102
-
103
-
104
-
105
-
106
-
107
-
108
-
109
-
110
-
111
-
112
-
113
-
114
-
115
-
116
-
117
-
118
-
119
-
120
-
121
-
122
-
123
-
124
-
125
-
126
-
127
-
128
-
129
-
130
-
131
-
132
-
133
-
134
-
135
-
136
-
137
-
138
-
139
-
140
-
141
-
142
-
143
-
144
-
145
-
146
-
147
-
148
-
149
-
150
-
151
-
152
-
153
-
154
-
155
-
156
-
157
-
158
-
159
-
160
-
161
-
162
-
163
-
164
-
165
-
166
-
167
-
168
-
169
-
170
-
171
-
172
-
173
-
174
-
175
-
176
-
177
-
178
-
179
-
180
-
181
-
182
-
183
-
184
-
185
-
186
-
187
-
188
-
189
-
190
-
191
-
192
-
193
-
194
-
195
-
196
-
197
-
198
-
199
-
200
-
201
-
202
-
203
-
204
-
205
-
206
-
207
-
208
-
209
-
210
-
211
-
212
-
213
-
214
-
215
-
216
-
217
-
218
-
219
-
220
-
221
-
222
-
223
-
224
-
225
-
226
-
227
-
228
-
229
-
230
-
231
-
232
-
233
-
234
-
235
-
236
-
237
-
238
-
239
-
240
-
241
-
242
-
243
-
244
-
245
-
246
-
247
-
248
-
249
-
250
-
251
-
252
-
253
-
254
-
255
-
256
-
257
-
258
-
259
-
260
-
261
-
262
-
263
-
264
-
265
-
266
-
267
-
268
-
269
-
270
-
271
-
272
-
273
-
274
 |
 |

ANNUAL REPORT 2011> 12 |
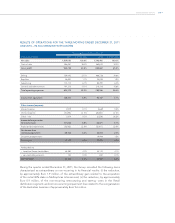
for the Australian/New Zealand retail operations. The effects from currency fluctuations
between the Euro, which is our reporting currency, and other currencies in which we
conduct business, in particular the weakness of the US Dollar, despite the strengthening
of the Australian Dollar compared to the Euro, decreased net sales in the retail distribution
segment by Euro 120.7 million.
Net sales to third parties in the manufacturing and wholesale distribution segment
increased by Euro 219.9 million, or 9.8 percent, to Euro 2,456.3 million in 2011 from
Euro 2,236.4 million in 2010. This increase was mainly attributable to increased sales of
most of our house brands , in particular Ray-Ban, Oakley and Persol, and of some designer
brands such as Tiffany, Ralph Lauren and Burberry. These sales volume increases occurred
in most of the geographic markets in which the Group operates. These positive effects
were partially impacted by currency fluctuations, in particular a weakness of the US Dollar
and despite a strengthening of Australian Dollar and other minor currencies, including but
not limited to the Brazilian Real, and the Japanese Yen, which combined still decreased
net sales to third parties in the manufacturing and wholesale distribution segment by Euro
30.4 million.
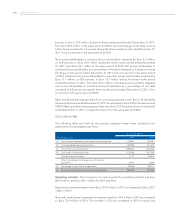
In 2011, net sales in the retail distribution segment accounted for approximately 60.5
percent of total net sales, as compared to approximately 61.4 percent of total net sales in
2010.
In 2011 and 2010, net sales in our retail distribution segment in the United States and
Canada comprised 79.9 percent of our total net sales in this segment. In US Dollars, retail
net sales in the United States and Canada increased by 7.4 percent to US$ 4,188.4 million
in 2011, from US$ 3,900.3 million in 2010, due to sales volume increases. During 2011,
net sales in the retail distribution segment in the rest of the world (excluding the United
States and Canada) comprised 20.1 percent of our total net sales in the retail distribution
segment and increased by 22.2 percent to Euro 757.2 million in 2011, from Euro 619.6
million, or 17.4 percent of our total net sales in the retail distribution segment in 2010,
mainly due to increase in consumer demand.
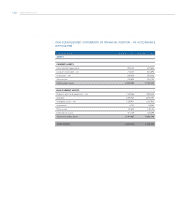
In 2011, net sales to third parties in our manufacturing and wholesale distribution segment
in Europe were Euro 1,128.9 million, comprising 46.0 percent of our total net sales
in this segment, compared to Euro 1,059.9 million, or 47.4 percent of total net sales in
the segment in 2010. The increase in net sales in Europe of Euro 69.0 million in 2011 as
compared to 2010 constituted a 6.5 percent increase in net sales to third parties, due to a
general increase in consumer demand. Net sales to third parties in our manufacturing and
wholesale distribution segment in the United States and Canada were US$ 830.1 million
and comprised 24.3 percent of our total net sales in this segment in 2011, compared to
US$ 715.8 million, or 24.1 percent of total net sales in the segment in 2010. The increase
in net sales in the United States and Canada in 2011 compared to 2010, was primarily
due to a general increase in consumer demand. In 2011, net sales to third parties in our
manufacturing and wholesale distribution segment in the rest of the world were Euro
731.1 million, comprising 29.8 percent of our total net sales in this segment, compared to
Euro 636.5 million, or 28.5 percent of our net sales in this segment in 2010. The increase of
Euro 94.5 million, or 14.8 percent, in 2011 as compared to 2010, was due to an increase in
consumer demand.