LensCrafters 2011 Annual Report Download - page 124
Download and view the complete annual report
Please find page 124 of the 2011 LensCrafters annual report below. You can navigate through the pages in the report by either clicking on the pages listed below, or by using the keyword search tool below to find specific information within the annual report.-
 1
1 -
2
-
3
-
4
-
5
-
6
-
7
-
8
-
9
-
10
-
11
-
12
-
13
-
14
-
15
-
16
-
17
-
18
-
19
-
20
-
21
-
22
-
23
-
24
-
25
-
26
-
27
-
28
-
29
-
30
-
31
-
32
-
33
-
34
-
35
-
36
-
37
-
38
-
39
-
40
-
41
-
42
-
43
-
44
-
45
-
46
-
47
-
48
-
49
-
50
-
51
-
52
-
53
-
54
-
55
-
56
-
57
-
58
-
59
-
60
-
61
-
62
-
63
-
64
-
65
-
66
-
67
-
68
-
69
-
70
-
71
-
72
-
73
-
74
-
75
-
76
-
77
-
78
-
79
-
80
-
81
-
82
-
83
-
84
-
85
-
86
-
87
-
88
-
89
-
90
-
91
-
92
-
93
-
94
-
95
-
96
-
97
-
98
-
99
-
100
-
101
-
102
-
103
-
104
-
105
-
106
-
107
-
108
-
109
-
110
-
111
-
112
-
113
-
 114
114 -
 115
115 -
 116
116 -
 117
117 -
 118
118 -
 119
119 -
 120
120 -
 121
121 -
 122
122 -
 123
123 -
 124
124 -
 125
125 -
 126
126 -
 127
127 -
 128
128 -
 129
129 -
 130
130 -
 131
131 -
 132
132 -
 133
133 -
 134
134 -
135
-
136
-
137
-
138
-
139
-
140
-
141
-
142
-
143
-
144
-
145
-
146
-
147
-
148
-
149
-
150
-
151
-
152
-
153
-
154
-
155
-
156
-
157
-
158
-
159
-
160
-
161
-
162
-
163
-
164
-
165
-
166
-
167
-
168
-
169
-
170
-
171
-
172
-
173
-
174
-
175
-
176
-
177
-
178
-
179
-
180
-
181
-
182
-
183
-
184
-
185
-
186
-
187
-
188
-
189
-
190
-
191
-
192
-
193
-
194
-
195
-
196
-
197
-
198
-
199
-
200
-
201
-
202
-
203
-
204
-
205
-
206
-
207
-
208
-
209
-
210
-
211
-
212
-
213
-
214
-
215
-
216
-
217
-
218
-
219
-
220
-
221
-
222
-
223
-
224
-
225
-
226
-
227
-
228
-
229
-
230
-
231
-
232
-
233
-
234
-
235
-
236
-
237
-
238
-
239
-
240
-
241
-
242
-
243
-
244
-
245
-
246
-
247
-
248
-
249
-
250
-
251
-
252
-
253
-
254
-
255
-
256
-
257
-
258
-
259
-
260
-
261
-
262
-
263
-
264
-
265
-
266
-
267
-
268
-
269
-
270
-
271
-
272
-
273
-
274
 |
 |
ANNUAL REPORT 2011> 48 |
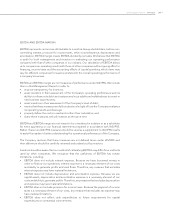
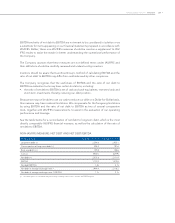
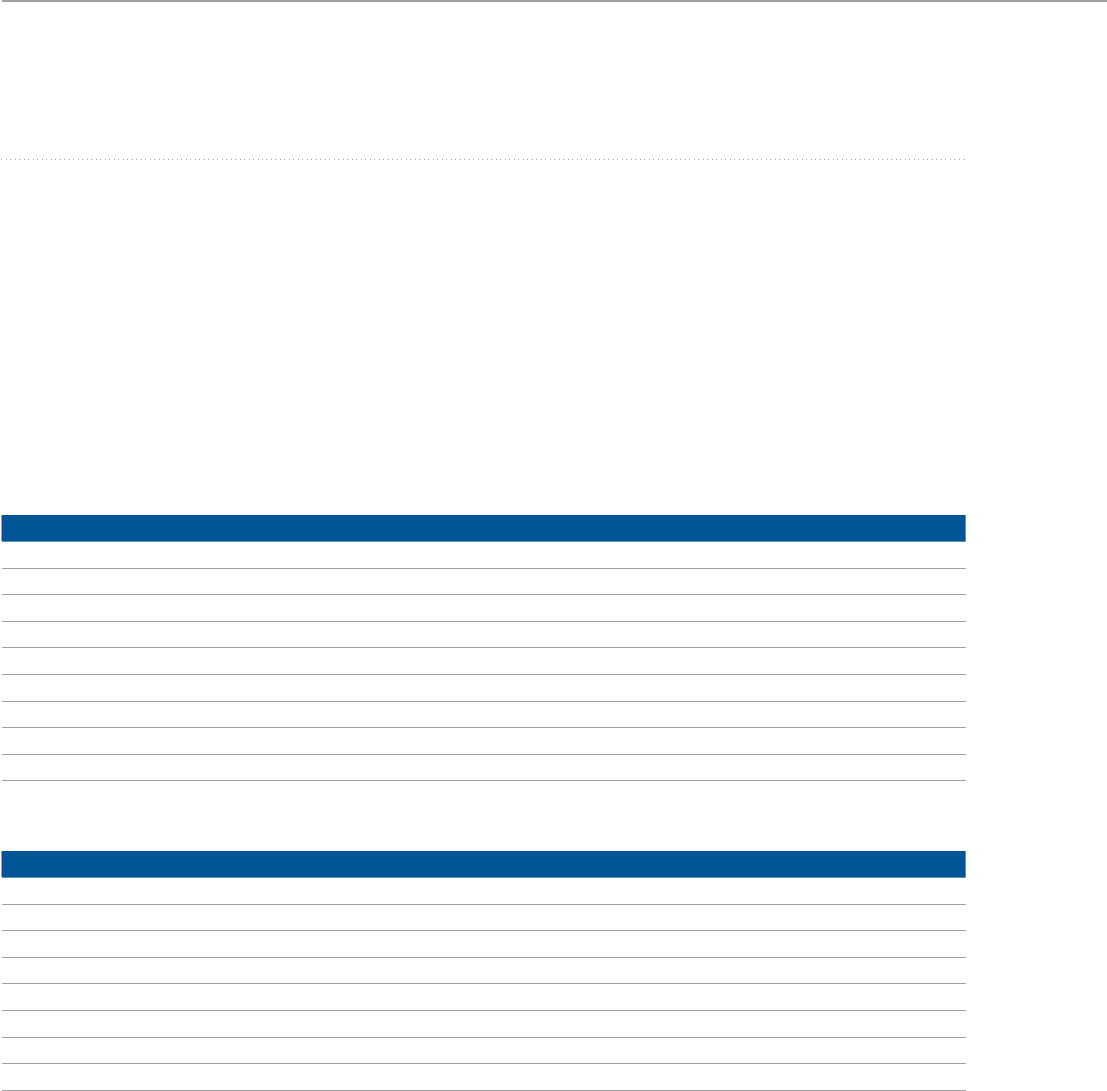
• EBITDA does not reflect changes in, or cash requirements for, working capital needs;
• EBITDA does not allow us to analyze the effect of certain recurring and non-recurring
items that materially affect our net income or loss.
We compensate for the foregoing limitations by using EBITDA as a comparative tool,
together with IAS/IFRS measurements, to assist in the evaluation of our operating
performance and leverage.
The following table provides a reconciliation of EBITDA to net income, which is the most
directly comparable IAS/IFRS financial measure, as well as the calculation of EBITDA
margin on net sales:
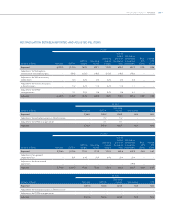
NON-IAS/IFRS MEASURE: EBITDA AND EBITDA MARGIN
(millions of Euro) 4Q 2010 4Q 2011 FY 2010 FY 2011
Net income/(loss) (+) 55.1 64.4 402.2 452.3
Discontinued operations (–) (19.9) – (19.9) –
Net income attributable to non-controlling interest (+) 0.9 0.7 5.1 6.0
Provision for income taxes (+) 32.0 36.8 218.2 237.0
Other (income)/expense (+) 28.1 26.5 106.6 111.9
Depreciation & amortization (+) 76.2 94.4 301.6 323.9
EBITDA (=) 172.3 222.8 1,013.8 1,131.0
Net sales (/) 1,346.5 1,509.0 5,798.0 6,222.5
EBITDA margin (=) 12.8% 14.8% 17.5% 18.2%
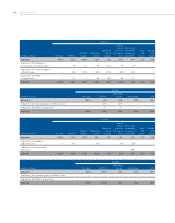
NON-IAS/IFRS MEASURE: ADJUSTED EBITDA AND ADJUSTED EBITDA MARGIN
(millions of Euro) 4Q 2010 4Q 2011 FY 2010 FY 2011
Net income/(loss) (+) 55.6 72.7 402.7 455.6
Net income attributable to non-controlling interest (+) 0.9 0.7 5.1 6.0
Provision for income taxes (+) 32.0 39.3 218.2 247.4
Other (income)/expense (+) 28.1 26.5 106.6 111.9
Depreciation & amortization (+) 76.2 85.5 301.6 315.0
EBITDA (=) 192.8 224.7 1,034.2 1,135.9
Net sales (/) 1,346.5 1,509.0 5,798.0 6,222.5
EBITDA margin (=) 14.3% 14.9% 17.8% 18.3%