LensCrafters 2011 Annual Report Download - page 94
Download and view the complete annual report
Please find page 94 of the 2011 LensCrafters annual report below. You can navigate through the pages in the report by either clicking on the pages listed below, or by using the keyword search tool below to find specific information within the annual report.-
 1
1 -
2
-
3
-
4
-
5
-
6
-
7
-
8
-
9
-
10
-
11
-
12
-
13
-
14
-
15
-
16
-
17
-
18
-
19
-
20
-
21
-
22
-
23
-
24
-
25
-
26
-
27
-
28
-
29
-
30
-
31
-
32
-
33
-
34
-
35
-
36
-
37
-
38
-
39
-
40
-
41
-
42
-
43
-
44
-
45
-
46
-
47
-
48
-
49
-
50
-
51
-
52
-
53
-
54
-
55
-
56
-
57
-
58
-
59
-
60
-
61
-
62
-
63
-
64
-
65
-
66
-
67
-
68
-
69
-
70
-
71
-
72
-
73
-
74
-
75
-
76
-
77
-
78
-
79
-
80
-
81
-
82
-
83
-
 84
84 -
 85
85 -
 86
86 -
 87
87 -
 88
88 -
 89
89 -
 90
90 -
 91
91 -
 92
92 -
 93
93 -
 94
94 -
 95
95 -
 96
96 -
 97
97 -
 98
98 -
 99
99 -
 100
100 -
 101
101 -
 102
102 -
 103
103 -
 104
104 -
105
-
106
-
107
-
108
-
109
-
110
-
111
-
112
-
113
-
114
-
115
-
116
-
117
-
118
-
119
-
120
-
121
-
122
-
123
-
124
-
125
-
126
-
127
-
128
-
129
-
130
-
131
-
132
-
133
-
134
-
135
-
136
-
137
-
138
-
139
-
140
-
141
-
142
-
143
-
144
-
145
-
146
-
147
-
148
-
149
-
150
-
151
-
152
-
153
-
154
-
155
-
156
-
157
-
158
-
159
-
160
-
161
-
162
-
163
-
164
-
165
-
166
-
167
-
168
-
169
-
170
-
171
-
172
-
173
-
174
-
175
-
176
-
177
-
178
-
179
-
180
-
181
-
182
-
183
-
184
-
185
-
186
-
187
-
188
-
189
-
190
-
191
-
192
-
193
-
194
-
195
-
196
-
197
-
198
-
199
-
200
-
201
-
202
-
203
-
204
-
205
-
206
-
207
-
208
-
209
-
210
-
211
-
212
-
213
-
214
-
215
-
216
-
217
-
218
-
219
-
220
-
221
-
222
-
223
-
224
-
225
-
226
-
227
-
228
-
229
-
230
-
231
-
232
-
233
-
234
-
235
-
236
-
237
-
238
-
239
-
240
-
241
-
242
-
243
-
244
-
245
-
246
-
247
-
248
-
249
-
250
-
251
-
252
-
253
-
254
-
255
-
256
-
257
-
258
-
259
-
260
-
261
-
262
-
263
-
264
-
265
-
266
-
267
-
268
-
269
-
270
-
271
-
272
-
273
-
274
 |
 |

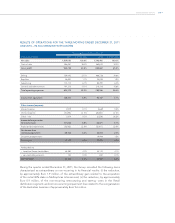
ANNUAL REPORT 2011> 18 |
the three-month period ended December 31, 2011, compared to US$ 157.1 million, or
22.4 percent of total net sales in the segment, in the same period of 2010. The increase in
net sales in the United States and Canada of US$ 26.1 million, or 16.6 percent, during the
three-month period ended December 31, 2011, compared to the same period of 2010,
was primarily due to a general increase in consumer demand. During the three-month
period ended December 31, 2011, net sales to third parties in our manufacturing and
wholesale distribution segment in the rest of the world were Euro 191.8 million, comprising
34.5 percent of our total net sales in this segment, compared to Euro 176.8 million in the
same period of 2010, or 34.4 percent of our net sales in this segment, which increase was
primarily due to a general increase in consumer demand.
Cost of sales. Cost of sales increased by Euro 85.5 million, or 18.5 percent, to Euro 546.3
million during the three-month period ended December 31, 2011, from Euro 460.8 million
in the same period of 2010. As a percentage of net sales, cost of sales increased to 36.2
percent during the three-month period ended December 31, 2011 as compared to 34.2
percent in the same period of 2010. During the three-month period ended December
31, 2011, the average number of frames produced daily in our facilities increased to
approximately 246,400 as compared to 228,200 in the same period of 2010, which was
attributable to increased production in all manufacturing facilities in response to an overall
increase in demand.
Gross profit. Our gross profit increased by Euro 77.1 million, or 8.7 percent, to Euro 962.7
million during the three-month period ended December 31, 2011, from Euro 885.7 million
in the same period of 2010, due to the factor noted above. As a percentage of net sales,
gross profit decreased to 63.8 percent during the three-month period ended December
31, 2011, from 65.8 percent in the same period of 2010, due to the factors noted above.
Operating expenses. Total operating expenses increased by Euro 44.8 million, or 5.7
percent, to Euro 834.4 million during the three-month period ended December 31, 2011,
from Euro 789.5 million in the same period of 2010, in line with the increase in net sales
during the period. As a percentage of net sales, operating expenses decreased to 55.3
percent during the three-month period ended December 31, 2011, from 58.6 percent in
the same period of 2010. Total operating expenses, excluding the above mentioned non-
recurring items, increased by Euro 54.4 million, or 7.1 percent, to Euro 823.5 million during
the three-month period ended December 31, 2011 from Euro 769.1 million in the same
period of 2010. As a percentage of net sales adjusted operating expenses decreased to
54.6 percent as compared to 57.1 percent in the same period of 2010.
Selling and advertising expenses (including royalty expenses) increased by Euro 57.9 million,
or 10.0 percent, to Euro 637.1 million during the three-month period ended December 31,
2011, from Euro 579.2 million in the same period of 2010. Selling expenses increased by Euro
40.5 million, or 8.6 percent. Advertising expenses increased by Euro 16.3 million, or 19.1
percent. Royalties increased by Euro 1.1 million, or 4.4 percent. As a percentage of net sales,
selling and advertising expenses were at 42.2 percent during the three-month period ended
December 31, 2011, compared to 43.0 percent for the same period of 2010.
Selling and advertising expenses (including royalty expenses), excluding the above mentioned
non-recurring items, increased by Euro 62.0 million, or 10.7 percent, to Euro 641.2 million