LensCrafters 2011 Annual Report Download - page 208
Download and view the complete annual report
Please find page 208 of the 2011 LensCrafters annual report below. You can navigate through the pages in the report by either clicking on the pages listed below, or by using the keyword search tool below to find specific information within the annual report.-
 1
1 -
2
-
3
-
4
-
5
-
6
-
7
-
8
-
9
-
10
-
11
-
12
-
13
-
14
-
15
-
16
-
17
-
18
-
19
-
20
-
21
-
22
-
23
-
24
-
25
-
26
-
27
-
28
-
29
-
30
-
31
-
32
-
33
-
34
-
35
-
36
-
37
-
38
-
39
-
40
-
41
-
42
-
43
-
44
-
45
-
46
-
47
-
48
-
49
-
50
-
51
-
52
-
53
-
54
-
55
-
56
-
57
-
58
-
59
-
60
-
61
-
62
-
63
-
64
-
65
-
66
-
67
-
68
-
69
-
70
-
71
-
72
-
73
-
74
-
75
-
76
-
77
-
78
-
79
-
80
-
81
-
82
-
83
-
84
-
85
-
86
-
87
-
88
-
89
-
90
-
91
-
92
-
93
-
94
-
95
-
96
-
97
-
98
-
99
-
100
-
101
-
102
-
103
-
104
-
105
-
106
-
107
-
108
-
109
-
110
-
111
-
112
-
113
-
114
-
115
-
116
-
117
-
118
-
119
-
120
-
121
-
122
-
123
-
124
-
125
-
126
-
127
-
128
-
129
-
130
-
131
-
132
-
133
-
134
-
135
-
136
-
137
-
138
-
139
-
140
-
141
-
142
-
143
-
144
-
145
-
146
-
147
-
148
-
149
-
150
-
151
-
152
-
153
-
154
-
155
-
156
-
157
-
158
-
159
-
160
-
161
-
162
-
163
-
164
-
165
-
166
-
167
-
168
-
169
-
170
-
171
-
172
-
173
-
174
-
175
-
176
-
177
-
178
-
179
-
180
-
181
-
182
-
183
-
184
-
185
-
186
-
187
-
188
-
189
-
190
-
191
-
192
-
193
-
194
-
195
-
196
-
197
-
 198
198 -
 199
199 -
 200
200 -
 201
201 -
 202
202 -
 203
203 -
 204
204 -
 205
205 -
 206
206 -
 207
207 -
 208
208 -
 209
209 -
 210
210 -
 211
211 -
 212
212 -
 213
213 -
 214
214 -
 215
215 -
 216
216 -
 217
217 -
 218
218 -
219
-
220
-
221
-
222
-
223
-
224
-
225
-
226
-
227
-
228
-
229
-
230
-
231
-
232
-
233
-
234
-
235
-
236
-
237
-
238
-
239
-
240
-
241
-
242
-
243
-
244
-
245
-
246
-
247
-
248
-
249
-
250
-
251
-
252
-
253
-
254
-
255
-
256
-
257
-
258
-
259
-
260
-
261
-
262
-
263
-
264
-
265
-
266
-
267
-
268
-
269
-
270
-
271
-
272
-
273
-
274
 |
 |

ANNUAL REPORT 2011> 132 |
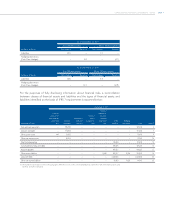
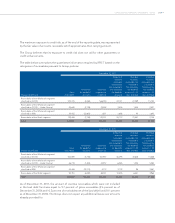
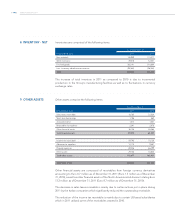
December 31, 2010
(thousands of Euro)
Financial
assets at fair
value through
profit and
loss
Accounts
receivabls
Investments
held until
maturity
Financial
assets
available for
sale
Financial
liabilities at
fair value
through
profit and
loss
Other
liabilities
Hedging
derivatives Total Note (*)
Cash and cash equivalents – 679,852 –––––679,852 6
Accounts receivable – 655,892 –––––655,892 7
Other current assets 1,484 61,843 – – – – – 63,327 9
Other non–current assets – 34,014 – – – – – 34,014 13
Short–term borrowings – – – – – 158,648 – 158,648 15
Current portion of long–term debt –––––197,566 – 197,566 16
Accounts payable –––––537,742 – 537,742 17
Other current liabilities – – – – 4,689 435,000 901 440,590 19
Long–term debt –––––2,435,071 – 2.435.071 20
Other non–current liabilities – – – – – 61,694 52,964 114,658 23
(*) The numbers reported above refer to the paragraphs within these notes to the consolidated nancial statements in which the nancial assets and
liabilities are further explained.
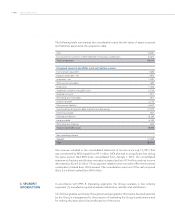
(f) Default risk: negative pledges and financial covenants
The financing agreements of the Group (see note 20) require compliance with negative
pledges and financial covenants, as set forth in the respective agreements, with the
exception of our Bond issue dated November 10, 2010 which requires compliance only
with negative pledges.
With regards to negative pledges, in general, the clauses prohibit the Company and
its subsidiaries from permitting any liens or security interests on any of their assets in
favor of third parties and without the consent of the lenders over a threshold equal to 30
percent of the Group consolidated stockholders’ equity. In addition, the sale of assets
of the Company and its subsidiaries is limited to a maximum threshold of 30 percent of
consolidated assets.
Default with respect to the abovementioned clauses – and following a grace period
during which the default can be remedied – would be considered a material breach of the
contractual obligations pursuant to the financing agreement of the Group.
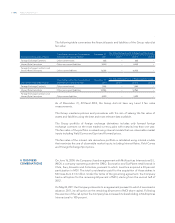
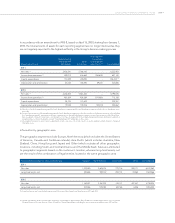
Financial covenants require the Group to comply with specific levels of financial ratios.
The most significant covenants establish a threshold for the ratio of net debt of the
Group to EBITDA (Earnings before interest, taxes, depreciation and amortization)
as well as EBITDA to financial charges. The covenants are reported in the following
table:
Net Financial Position/Pro forma EBITDA < 3.5 x
EBITDA/PRO forma financial charges > 5 x