LensCrafters 2011 Annual Report Download - page 126
Download and view the complete annual report
Please find page 126 of the 2011 LensCrafters annual report below. You can navigate through the pages in the report by either clicking on the pages listed below, or by using the keyword search tool below to find specific information within the annual report.-
 1
1 -
2
-
3
-
4
-
5
-
6
-
7
-
8
-
9
-
10
-
11
-
12
-
13
-
14
-
15
-
16
-
17
-
18
-
19
-
20
-
21
-
22
-
23
-
24
-
25
-
26
-
27
-
28
-
29
-
30
-
31
-
32
-
33
-
34
-
35
-
36
-
37
-
38
-
39
-
40
-
41
-
42
-
43
-
44
-
45
-
46
-
47
-
48
-
49
-
50
-
51
-
52
-
53
-
54
-
55
-
56
-
57
-
58
-
59
-
60
-
61
-
62
-
63
-
64
-
65
-
66
-
67
-
68
-
69
-
70
-
71
-
72
-
73
-
74
-
75
-
76
-
77
-
78
-
79
-
80
-
81
-
82
-
83
-
84
-
85
-
86
-
87
-
88
-
89
-
90
-
91
-
92
-
93
-
94
-
95
-
96
-
97
-
98
-
99
-
100
-
101
-
102
-
103
-
104
-
105
-
106
-
107
-
108
-
109
-
110
-
111
-
112
-
113
-
114
-
115
-
 116
116 -
 117
117 -
 118
118 -
 119
119 -
 120
120 -
 121
121 -
 122
122 -
 123
123 -
 124
124 -
 125
125 -
 126
126 -
 127
127 -
 128
128 -
 129
129 -
 130
130 -
 131
131 -
 132
132 -
 133
133 -
 134
134 -
 135
135 -
 136
136 -
137
-
138
-
139
-
140
-
141
-
142
-
143
-
144
-
145
-
146
-
147
-
148
-
149
-
150
-
151
-
152
-
153
-
154
-
155
-
156
-
157
-
158
-
159
-
160
-
161
-
162
-
163
-
164
-
165
-
166
-
167
-
168
-
169
-
170
-
171
-
172
-
173
-
174
-
175
-
176
-
177
-
178
-
179
-
180
-
181
-
182
-
183
-
184
-
185
-
186
-
187
-
188
-
189
-
190
-
191
-
192
-
193
-
194
-
195
-
196
-
197
-
198
-
199
-
200
-
201
-
202
-
203
-
204
-
205
-
206
-
207
-
208
-
209
-
210
-
211
-
212
-
213
-
214
-
215
-
216
-
217
-
218
-
219
-
220
-
221
-
222
-
223
-
224
-
225
-
226
-
227
-
228
-
229
-
230
-
231
-
232
-
233
-
234
-
235
-
236
-
237
-
238
-
239
-
240
-
241
-
242
-
243
-
244
-
245
-
246
-
247
-
248
-
249
-
250
-
251
-
252
-
253
-
254
-
255
-
256
-
257
-
258
-
259
-
260
-
261
-
262
-
263
-
264
-
265
-
266
-
267
-
268
-
269
-
270
-
271
-
272
-
273
-
274
 |
 |

ANNUAL REPORT 2011> 50 |
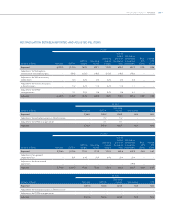
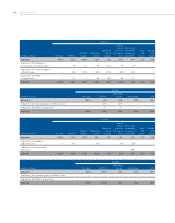
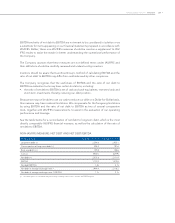
The following table provides a reconciliation of free cash flow to EBITDA, which is the most
directly comparable IAS/IFRS financial measure:
NON-IAS/IFRS MEASURE: FREE CASH FLOW
(millions of Euro) FY 2011
EBITDA (1) 1,136
C working capital 13
Capex (307)
Operating cash flow 842
Financial charges (2) (109)
Taxes (229)
Extraordinary charges (3) (8)
Free cash flow 496
(1) EBITDA is not an IAS/IFRS measure; please see table on the earlier page for a reconciliation of EBITDA to net income.
(2) Equals interest income minus interest expense.
(3) Equals extraordinary income minus extraordinary expense.
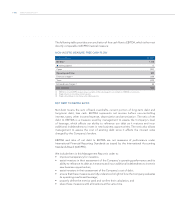
NET DEBT TO EBITDA RATIO
Net debt means the sum of bank overdrafts, current portion of long-term debt and
long-term debt, less cash. EBITDA represents net income before non-controlling
interest, taxes, other income/expense, depreciation and amortization. The ratio of net
debt to EBITDA is a measure used by management to assess the Company’s level
of leverage, which affects our ability to refinance our debt as it matures and incur
additional indebtedness to invest in new business opportunities. The ratio also allows
management to assess the cost of existing debt since it affects the interest rates
charged by the Company’s lenders.
EBITDA and ratio of net debt to EBITDA are not measures of performance under
International Financial Reporting Standards as issued by the International Accounting
Standards Board (IAS/IFRS).
We include them in this Management Report in order to:
• improve transparency for investors;
• assist investors in their assessment of the Company’s operating performance and its
ability to refinance its debt as it matures and incur additional indebtedness to invest in
new business opportunities;
• assist investors in their assessment of the Company’s cost of debt;
• ensure that these measures are fully understood in light of how the Company evaluates
its operating results and leverage;
• properly define the metrics used and confirm their calculation; and
• share these measures with all investors at the same time.