LensCrafters 2011 Annual Report Download - page 212
Download and view the complete annual report
Please find page 212 of the 2011 LensCrafters annual report below. You can navigate through the pages in the report by either clicking on the pages listed below, or by using the keyword search tool below to find specific information within the annual report.-
 1
1 -
2
-
3
-
4
-
5
-
6
-
7
-
8
-
9
-
10
-
11
-
12
-
13
-
14
-
15
-
16
-
17
-
18
-
19
-
20
-
21
-
22
-
23
-
24
-
25
-
26
-
27
-
28
-
29
-
30
-
31
-
32
-
33
-
34
-
35
-
36
-
37
-
38
-
39
-
40
-
41
-
42
-
43
-
44
-
45
-
46
-
47
-
48
-
49
-
50
-
51
-
52
-
53
-
54
-
55
-
56
-
57
-
58
-
59
-
60
-
61
-
62
-
63
-
64
-
65
-
66
-
67
-
68
-
69
-
70
-
71
-
72
-
73
-
74
-
75
-
76
-
77
-
78
-
79
-
80
-
81
-
82
-
83
-
84
-
85
-
86
-
87
-
88
-
89
-
90
-
91
-
92
-
93
-
94
-
95
-
96
-
97
-
98
-
99
-
100
-
101
-
102
-
103
-
104
-
105
-
106
-
107
-
108
-
109
-
110
-
111
-
112
-
113
-
114
-
115
-
116
-
117
-
118
-
119
-
120
-
121
-
122
-
123
-
124
-
125
-
126
-
127
-
128
-
129
-
130
-
131
-
132
-
133
-
134
-
135
-
136
-
137
-
138
-
139
-
140
-
141
-
142
-
143
-
144
-
145
-
146
-
147
-
148
-
149
-
150
-
151
-
152
-
153
-
154
-
155
-
156
-
157
-
158
-
159
-
160
-
161
-
162
-
163
-
164
-
165
-
166
-
167
-
168
-
169
-
170
-
171
-
172
-
173
-
174
-
175
-
176
-
177
-
178
-
179
-
180
-
181
-
182
-
183
-
184
-
185
-
186
-
187
-
188
-
189
-
190
-
191
-
192
-
193
-
194
-
195
-
196
-
197
-
198
-
199
-
200
-
201
-
 202
202 -
 203
203 -
 204
204 -
 205
205 -
 206
206 -
 207
207 -
 208
208 -
 209
209 -
 210
210 -
 211
211 -
 212
212 -
 213
213 -
 214
214 -
 215
215 -
 216
216 -
 217
217 -
 218
218 -
 219
219 -
 220
220 -
 221
221 -
 222
222 -
223
-
224
-
225
-
226
-
227
-
228
-
229
-
230
-
231
-
232
-
233
-
234
-
235
-
236
-
237
-
238
-
239
-
240
-
241
-
242
-
243
-
244
-
245
-
246
-
247
-
248
-
249
-
250
-
251
-
252
-
253
-
254
-
255
-
256
-
257
-
258
-
259
-
260
-
261
-
262
-
263
-
264
-
265
-
266
-
267
-
268
-
269
-
270
-
271
-
272
-
273
-
274
 |
 |

ANNUAL REPORT 2011> 136 |
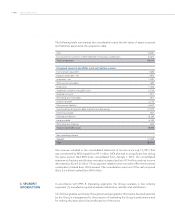
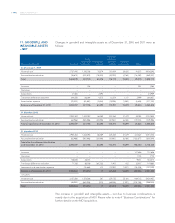
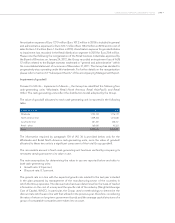
The following table summarizes the consideration paid, the fair value of assets acquired
and liabilities assumed at the acquisition date:
Cash 95,401
Fair value of the investment in MOI held before the business combination 63,613
Total consideration 159,014
Recognized amount of identifiable assets and liabilities assumed
Cash and cash equivalents 5,608
Accounts receivable – net 4,976
Inventories – net 13,497
Other current receivables 1,693
Fixed assets 17,436
Trademarks and other intangible assets 23,136
Deferred tax assets 3,571
Other long-term receivables 1,917
Accounts payable (7,778)
Other current liabilities (4,879)
Current portion of long-term debt and short-term borrowings (11,575)
Income tax payable (357)
Deferred tax liabilities (6,129)
Long-term debt (5,339)
Other long-term liabilities (224)
Total net identifiable assets 35,555
Non-controlling interests –
Goodwill 123,459
Total 159,014
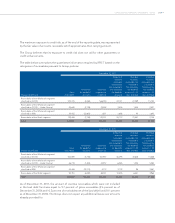
The revenue included in the consolidated statement of income since July 13, 2011 that
was contributed by MOI equals Euro 49.1 million. MOI also had an insignificant loss during
the same period. Had MOI been consolidated from January 1, 2011, the consolidated
statement of income would show net sales increased by Euro 41.9 million and net income
decreased by Euro 0.3 million. The acquisition related costs incurred to effect the business
combination totaled Euro 165 thousand. The consideration paid net of the cash acquired
(Euro 5.6 million) totaled Euro 89.8 million.
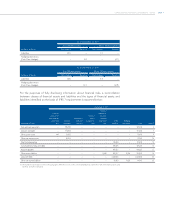
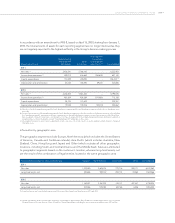
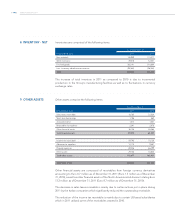
In accordance with IFRS 8, Operating segments, the Group operates in two industry
segments: (1) manufacturing and wholesale distribution, and (2) retail distribution.
The following tables summarize the segment and geographic information deemed essential
by the Group’s management for the purpose of evaluating the Group’s performance and
for making decisions about future allocations of resources.
5. SEGMENT
INFORMATION