LensCrafters 2011 Annual Report Download - page 221
Download and view the complete annual report
Please find page 221 of the 2011 LensCrafters annual report below. You can navigate through the pages in the report by either clicking on the pages listed below, or by using the keyword search tool below to find specific information within the annual report.-
 1
1 -
2
-
3
-
4
-
5
-
6
-
7
-
8
-
9
-
10
-
11
-
12
-
13
-
14
-
15
-
16
-
17
-
18
-
19
-
20
-
21
-
22
-
23
-
24
-
25
-
26
-
27
-
28
-
29
-
30
-
31
-
32
-
33
-
34
-
35
-
36
-
37
-
38
-
39
-
40
-
41
-
42
-
43
-
44
-
45
-
46
-
47
-
48
-
49
-
50
-
51
-
52
-
53
-
54
-
55
-
56
-
57
-
58
-
59
-
60
-
61
-
62
-
63
-
64
-
65
-
66
-
67
-
68
-
69
-
70
-
71
-
72
-
73
-
74
-
75
-
76
-
77
-
78
-
79
-
80
-
81
-
82
-
83
-
84
-
85
-
86
-
87
-
88
-
89
-
90
-
91
-
92
-
93
-
94
-
95
-
96
-
97
-
98
-
99
-
100
-
101
-
102
-
103
-
104
-
105
-
106
-
107
-
108
-
109
-
110
-
111
-
112
-
113
-
114
-
115
-
116
-
117
-
118
-
119
-
120
-
121
-
122
-
123
-
124
-
125
-
126
-
127
-
128
-
129
-
130
-
131
-
132
-
133
-
134
-
135
-
136
-
137
-
138
-
139
-
140
-
141
-
142
-
143
-
144
-
145
-
146
-
147
-
148
-
149
-
150
-
151
-
152
-
153
-
154
-
155
-
156
-
157
-
158
-
159
-
160
-
161
-
162
-
163
-
164
-
165
-
166
-
167
-
168
-
169
-
170
-
171
-
172
-
173
-
174
-
175
-
176
-
177
-
178
-
179
-
180
-
181
-
182
-
183
-
184
-
185
-
186
-
187
-
188
-
189
-
190
-
191
-
192
-
193
-
194
-
195
-
196
-
197
-
198
-
199
-
200
-
201
-
202
-
203
-
204
-
205
-
206
-
207
-
208
-
209
-
210
-
 211
211 -
 212
212 -
 213
213 -
 214
214 -
 215
215 -
 216
216 -
 217
217 -
 218
218 -
 219
219 -
 220
220 -
 221
221 -
 222
222 -
 223
223 -
 224
224 -
 225
225 -
 226
226 -
 227
227 -
 228
228 -
 229
229 -
 230
230 -
 231
231 -
232
-
233
-
234
-
235
-
236
-
237
-
238
-
239
-
240
-
241
-
242
-
243
-
244
-
245
-
246
-
247
-
248
-
249
-
250
-
251
-
252
-
253
-
254
-
255
-
256
-
257
-
258
-
259
-
260
-
261
-
262
-
263
-
264
-
265
-
266
-
267
-
268
-
269
-
270
-
271
-
272
-
273
-
274
 |
 |

| 145 >CONSOLIDATED FINANCIAL STATEMENTS - NOTES
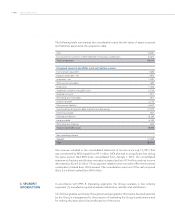
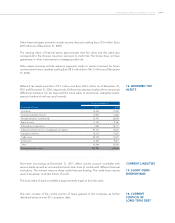
Amortization expense of Euro 127.9 million (Euro 107.2 million in 2010) is included in general
and administrative expenses for Euro 124.7 million (Euro 106.2 million in 2010) and in cost of
sales for Euro 3.2 million (Euro 1.0 million in 2010). Amortization expense for goodwill relates
to impairment loss recorded in the Retail distribution segment in 2010 for Euro 20.4 million.
Please note that following the reorganization of the Retail business in Australia, approved by
the Board of Directors on January 24, 2012, the Group recorded an impairment loss of AU$
12 million related to the Budget eyewear trademark in “general and administrative” within
the consolidated statement of income as of December 31, 2011. The Group has decided to
progressively stop operating under this trademark. For further details on the reorganization
please refer to Section 12 “Subsequent Events” of the accompanying Management Report.
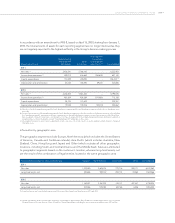
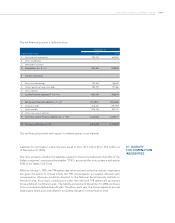
Impairment of goodwill
Pursuant to IAS 36 – Impairment of Assets –, the Group has identified the following four
cash-generating units: Wholesale, Retail North America, Retail Asia-Pacific and Retail
Other. The cash-generating units reflect the distribution model adopted by the Group.
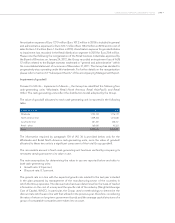
The value of goodwill allocated to each cash-generating unit is reported in the following
table:
(thousands of Euro) 2011 2010
Wholesale 1,134,742 1,116,119
North America retail 1,409,353 1,372,638
Asia-Pacific retail 381,387 358,317
Retail – other 165,081 43,323
Total 3.090,563 2,890,397
The information required by paragraph 134 of IAS 36 is provided below only for the
Wholesale and Retail North America cash-generating units, since the value of goodwill
allocated to these two units is a significant component of the total Group goodwill.
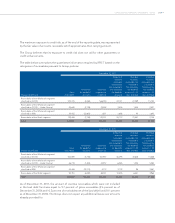
The recoverable amount of each cash-generating unit has been verified by comparing its
net assets carrying amounts to its value in use.
The main assumptions for determining the value in use are reported below and refer to
both cash-generating units:
• Growth rate: 2.0 percent;
• Discount rate: 8.1 percent.
This growth rate is in line with the expected growth rate related to the last year included
in the plan prepared by management of the manufacturing sector of the countries in
which the Group operates. The discount rate has been determined on the basis of market
information on the cost of money and the specific risk of the industry (Weighted Average
Cost of Capital, WACC). In particular, the Group used a methodology to determine the
discount rate which was in line with that utilized in the previous year, therefore, considering
the rates of return on long-term government bonds and the average capital structure of a
group of comparable companies were taken into account.