LensCrafters 2011 Annual Report Download - page 213
Download and view the complete annual report
Please find page 213 of the 2011 LensCrafters annual report below. You can navigate through the pages in the report by either clicking on the pages listed below, or by using the keyword search tool below to find specific information within the annual report.-
 1
1 -
2
-
3
-
4
-
5
-
6
-
7
-
8
-
9
-
10
-
11
-
12
-
13
-
14
-
15
-
16
-
17
-
18
-
19
-
20
-
21
-
22
-
23
-
24
-
25
-
26
-
27
-
28
-
29
-
30
-
31
-
32
-
33
-
34
-
35
-
36
-
37
-
38
-
39
-
40
-
41
-
42
-
43
-
44
-
45
-
46
-
47
-
48
-
49
-
50
-
51
-
52
-
53
-
54
-
55
-
56
-
57
-
58
-
59
-
60
-
61
-
62
-
63
-
64
-
65
-
66
-
67
-
68
-
69
-
70
-
71
-
72
-
73
-
74
-
75
-
76
-
77
-
78
-
79
-
80
-
81
-
82
-
83
-
84
-
85
-
86
-
87
-
88
-
89
-
90
-
91
-
92
-
93
-
94
-
95
-
96
-
97
-
98
-
99
-
100
-
101
-
102
-
103
-
104
-
105
-
106
-
107
-
108
-
109
-
110
-
111
-
112
-
113
-
114
-
115
-
116
-
117
-
118
-
119
-
120
-
121
-
122
-
123
-
124
-
125
-
126
-
127
-
128
-
129
-
130
-
131
-
132
-
133
-
134
-
135
-
136
-
137
-
138
-
139
-
140
-
141
-
142
-
143
-
144
-
145
-
146
-
147
-
148
-
149
-
150
-
151
-
152
-
153
-
154
-
155
-
156
-
157
-
158
-
159
-
160
-
161
-
162
-
163
-
164
-
165
-
166
-
167
-
168
-
169
-
170
-
171
-
172
-
173
-
174
-
175
-
176
-
177
-
178
-
179
-
180
-
181
-
182
-
183
-
184
-
185
-
186
-
187
-
188
-
189
-
190
-
191
-
192
-
193
-
194
-
195
-
196
-
197
-
198
-
199
-
200
-
201
-
202
-
 203
203 -
 204
204 -
 205
205 -
 206
206 -
 207
207 -
 208
208 -
 209
209 -
 210
210 -
 211
211 -
 212
212 -
 213
213 -
 214
214 -
 215
215 -
 216
216 -
 217
217 -
 218
218 -
 219
219 -
 220
220 -
 221
221 -
 222
222 -
 223
223 -
224
-
225
-
226
-
227
-
228
-
229
-
230
-
231
-
232
-
233
-
234
-
235
-
236
-
237
-
238
-
239
-
240
-
241
-
242
-
243
-
244
-
245
-
246
-
247
-
248
-
249
-
250
-
251
-
252
-
253
-
254
-
255
-
256
-
257
-
258
-
259
-
260
-
261
-
262
-
263
-
264
-
265
-
266
-
267
-
268
-
269
-
270
-
271
-
272
-
273
-
274
 |
 |
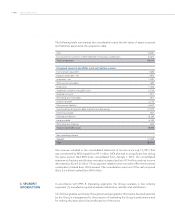
| 137 >CONSOLIDATED FINANCIAL STATEMENTS - NOTES
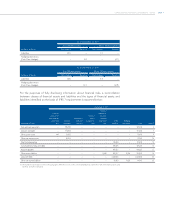
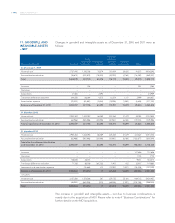
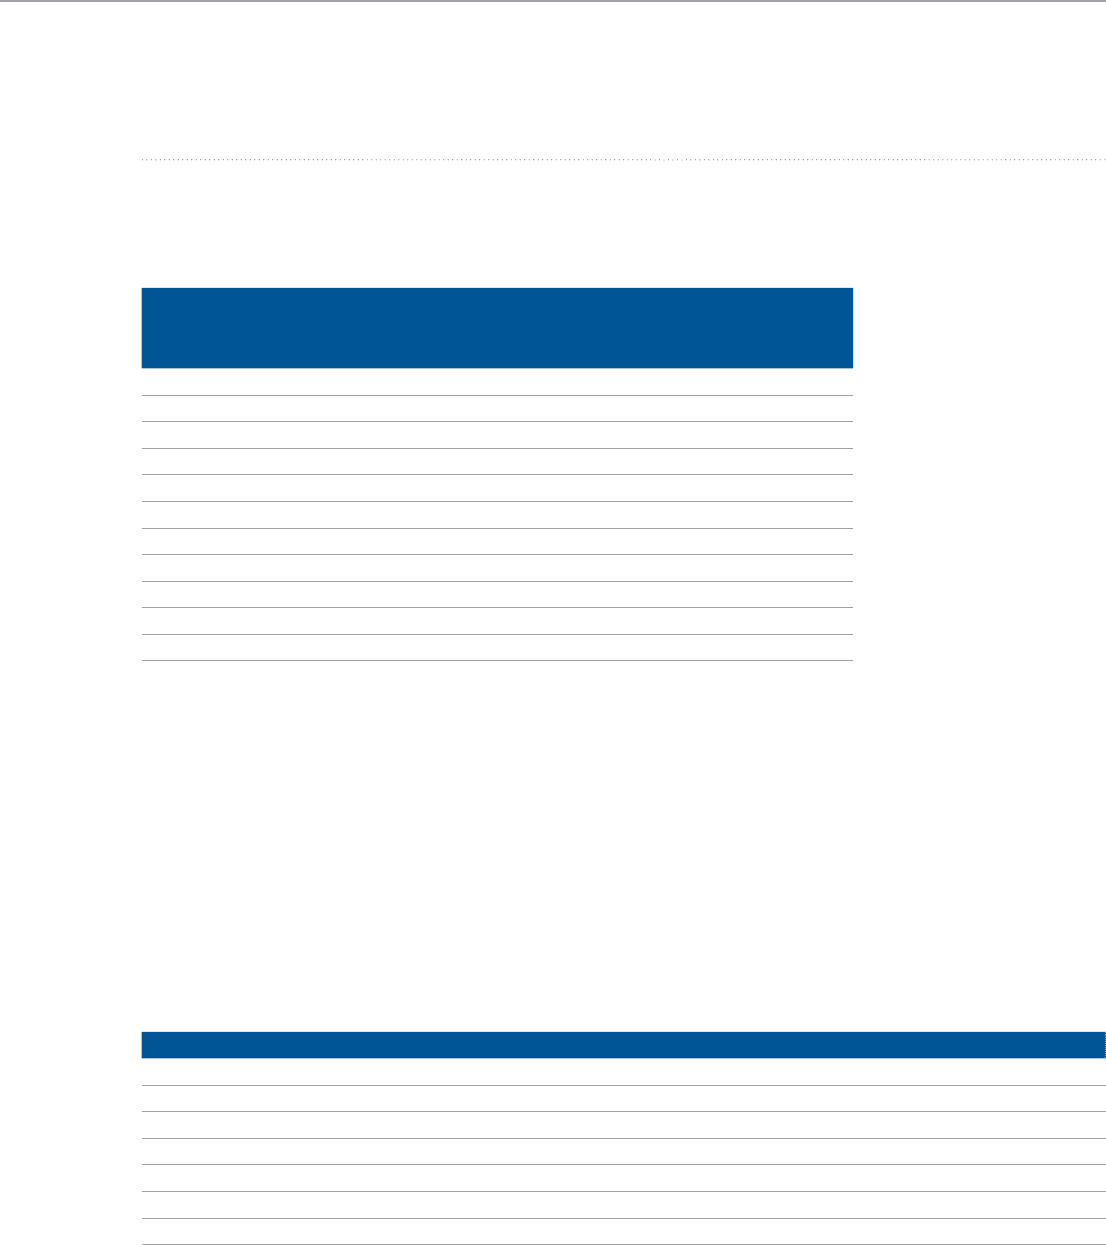
In accordance with an amendment to IFRS 8, issued on April 16, 2009, starting from January 1,
2010, the total amounts of assets for each reporting segment are no longer disclosed as they
are not regularly reported to the highest authority in the Group’s decision-making process.(1)
(thousands of Euro)
Manufacturing
and wholesale
distribution
Retail
distribution
Inter-segment
transactions
and corporate
adjustments (c) Consolidated
2011
Net sales (a) 2,456,341 3,766,142 – 6,222,483
Income from operations (b) 529,073 436,869 (158,802) 807,140
Capital expenditures 153,229 205,094 – 358,323 (1)
Depreciation and amortization 85,765 148,292 89,831 323,888
2010
Net sales (a) 2,236,403 3,561,632 – 5,798,035
Income from operations (b) 461,854 424,384 (174,080) 712,158
Capital expenditures 98,724 131,633 – 230,357
Depreciation and amortization 79,028 139,216 103,818 322,062
(a) Net sales of both the manufacturing and wholesale distribution segment and the retail distribution segment include sales to third-party custo-
mers only.
(b) Income from operations of the manufacturing and wholesale distribution segment is related to net sales to third-party customers only, excluding
the “manufacturing pro t” generated on the inter-company sales to the retail distribution segment. Income from operations of the Retail Distri-
bution segment is related to retail sales, considering the cost of goods acquired from the manufacturing and wholesale distribution segment at
manufacturing cost, thus including the relevant “manufacturing pro t” attributable to those sales.
(c) Inter-segment transactions and corporate adjustments include corporate costs not allocated to a speci c segment and amortization of acquired
intangible assets.
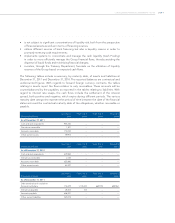
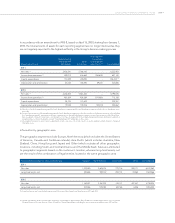
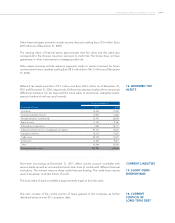
Information by geographic area
The geographic segments include Europe, North America (which includes the United States
of America, Canada and Caribbean islands), Asia-Pacific (which includes Australia, New
Zealand, China, Hong Kong and Japan) and Other (which includes all other geographic
locations, including South and Central America and the Middle East). Sales are attributed
to geographic segments based on the customer’s location, whereas long-lived assets, net
are the result of the combination of legal entities located in the same geographic area.
Years ended December 31, (thousands of Euro) Europe (*) North America Asia-Pacific Other Consolidated
2011
Net sales 1,243,280 3,605,314 779,718 594,171 6,222,483
Long-lived assets, net 340,648 594,722 200,134 33,562 1,169,066
2010
Net sales 1,163,527 3,481,924 745,137 407,447 5,798,035
Long-lived assets, net 323,586 595,044 169,168 8,406 1,096,204
(*) Long-lived assets, net located in Italy represented 27 percent of the Group’s total xed assets in 2011 and 2010.
(1) Capital expenditures in 2011 include (i) the acquisition of a building for approximately Euro 25 million (for further details please see note 28 and
(ii) capital leases of the retail division of Euro 25.6 million. Capital expenditures excluding the above mentioned additions were 307.5 million.