LensCrafters 2011 Annual Report Download - page 101
Download and view the complete annual report
Please find page 101 of the 2011 LensCrafters annual report below. You can navigate through the pages in the report by either clicking on the pages listed below, or by using the keyword search tool below to find specific information within the annual report.-
 1
1 -
2
-
3
-
4
-
5
-
6
-
7
-
8
-
9
-
10
-
11
-
12
-
13
-
14
-
15
-
16
-
17
-
18
-
19
-
20
-
21
-
22
-
23
-
24
-
25
-
26
-
27
-
28
-
29
-
30
-
31
-
32
-
33
-
34
-
35
-
36
-
37
-
38
-
39
-
40
-
41
-
42
-
43
-
44
-
45
-
46
-
47
-
48
-
49
-
50
-
51
-
52
-
53
-
54
-
55
-
56
-
57
-
58
-
59
-
60
-
61
-
62
-
63
-
64
-
65
-
66
-
67
-
68
-
69
-
70
-
71
-
72
-
73
-
74
-
75
-
76
-
77
-
78
-
79
-
80
-
81
-
82
-
83
-
84
-
85
-
86
-
87
-
88
-
89
-
90
-
 91
91 -
 92
92 -
 93
93 -
 94
94 -
 95
95 -
 96
96 -
 97
97 -
 98
98 -
 99
99 -
 100
100 -
 101
101 -
 102
102 -
 103
103 -
 104
104 -
 105
105 -
 106
106 -
 107
107 -
 108
108 -
 109
109 -
 110
110 -
 111
111 -
112
-
113
-
114
-
115
-
116
-
117
-
118
-
119
-
120
-
121
-
122
-
123
-
124
-
125
-
126
-
127
-
128
-
129
-
130
-
131
-
132
-
133
-
134
-
135
-
136
-
137
-
138
-
139
-
140
-
141
-
142
-
143
-
144
-
145
-
146
-
147
-
148
-
149
-
150
-
151
-
152
-
153
-
154
-
155
-
156
-
157
-
158
-
159
-
160
-
161
-
162
-
163
-
164
-
165
-
166
-
167
-
168
-
169
-
170
-
171
-
172
-
173
-
174
-
175
-
176
-
177
-
178
-
179
-
180
-
181
-
182
-
183
-
184
-
185
-
186
-
187
-
188
-
189
-
190
-
191
-
192
-
193
-
194
-
195
-
196
-
197
-
198
-
199
-
200
-
201
-
202
-
203
-
204
-
205
-
206
-
207
-
208
-
209
-
210
-
211
-
212
-
213
-
214
-
215
-
216
-
217
-
218
-
219
-
220
-
221
-
222
-
223
-
224
-
225
-
226
-
227
-
228
-
229
-
230
-
231
-
232
-
233
-
234
-
235
-
236
-
237
-
238
-
239
-
240
-
241
-
242
-
243
-
244
-
245
-
246
-
247
-
248
-
249
-
250
-
251
-
252
-
253
-
254
-
255
-
256
-
257
-
258
-
259
-
260
-
261
-
262
-
263
-
264
-
265
-
266
-
267
-
268
-
269
-
270
-
271
-
272
-
273
-
274
 |
 |

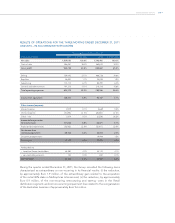
| 25 >MANAGEMENT REPORT
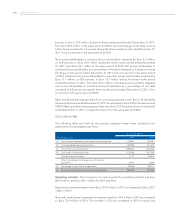
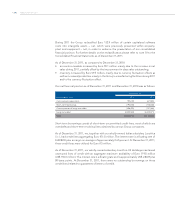
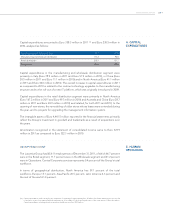
Capital expenditures amounted to Euro 358.3 million in 2011 (14) and Euro 230.5 million in
2010, analyzed as follows:
Operating segment (millions of Euro) 2011 2010
Manufacturing and wholesale distribution 153.2 98.8
Retail distribution 205 .1 131.7
Group total 358.3 230.5
Capital expenditures in the manufacturing and wholesale distribution segment were
primarily in Italy (Euro 78.9 million in 2011 and Euro 51.9 million in 2010), in China (Euro
24.5 million in 2011 and Euro 11.1 million in 2010) and in North America (Euro 41.1 million
in 2011 and Euro 30.0 million in 2010). The overall increase in capital expenditures in 2011
as compared to 2010 is related to the routine technology upgrades to the manufacturing
structure and to the roll-out of a new IT platform, which was originally introduced in 2009.
Capital expenditures in the retail distribution segment were primarily in North America
(Euro 167.2 million in 2011 and Euro 99.3 million in 2010) and Australia and China (Euro 28.7
million in 2011 and Euro 24.9 million in 2010) and related, for both 2011 and 2010, to the
opening of new stores, the remodeling of older stores whose leases were extended during
the year, and to projects for upgrading the management information system.
The intangible assets of Euro 4,441.5 million reported in the financial statements primarily
reflect the Group’s investment in goodwill and trademarks as a result of acquisitions over
the years.
Amortization recognized in the statement of consolidated income came to Euro 323.9
million in 2011 as compared to Euro 322.1 million in 2010.
GROUP HEADCOUNT
The Luxottica Group had 65,611 employees as of December 31, 2011, of which 66.7 percent
were in the Retail segment, 11.7 percent were in the Wholesale segment and 21.2 percent
were in Operations. Central Corporate services represents 0.4 percent of the Group’s total
workforce.
In terms of geographical distribution, North America has 59.1 percent of the total
workforce, Europe 15.1 percent, Asia-Pacific 20.5 percent, Latin America 4.3 percent and
the rest of the world 1.0 percent.
(14) Capital expenditures in 2011 include (i) the acquisition of a building for approximately Euro 25 million (for further details please see note 28
to the Notes to the Consolidated Financial Statements as of December 31, 2011) and capital leases of the retail division of Euro 25.6 million.
Capital expenditures excluding the above mentioned additions were Euro 307.5 million.
4. CAPITAL
EXPENDITURES
5. HUMAN
RESOURCES