LensCrafters 2011 Annual Report Download - page 87
Download and view the complete annual report
Please find page 87 of the 2011 LensCrafters annual report below. You can navigate through the pages in the report by either clicking on the pages listed below, or by using the keyword search tool below to find specific information within the annual report.-
 1
1 -
2
-
3
-
4
-
5
-
6
-
7
-
8
-
9
-
10
-
11
-
12
-
13
-
14
-
15
-
16
-
17
-
18
-
19
-
20
-
21
-
22
-
23
-
24
-
25
-
26
-
27
-
28
-
29
-
30
-
31
-
32
-
33
-
34
-
35
-
36
-
37
-
38
-
39
-
40
-
41
-
42
-
43
-
44
-
45
-
46
-
47
-
48
-
49
-
50
-
51
-
52
-
53
-
54
-
55
-
56
-
57
-
58
-
59
-
60
-
61
-
62
-
63
-
64
-
65
-
66
-
67
-
68
-
69
-
70
-
71
-
72
-
73
-
74
-
75
-
76
-
 77
77 -
 78
78 -
 79
79 -
 80
80 -
 81
81 -
 82
82 -
 83
83 -
 84
84 -
 85
85 -
 86
86 -
 87
87 -
 88
88 -
 89
89 -
 90
90 -
 91
91 -
 92
92 -
 93
93 -
 94
94 -
 95
95 -
 96
96 -
 97
97 -
98
-
99
-
100
-
101
-
102
-
103
-
104
-
105
-
106
-
107
-
108
-
109
-
110
-
111
-
112
-
113
-
114
-
115
-
116
-
117
-
118
-
119
-
120
-
121
-
122
-
123
-
124
-
125
-
126
-
127
-
128
-
129
-
130
-
131
-
132
-
133
-
134
-
135
-
136
-
137
-
138
-
139
-
140
-
141
-
142
-
143
-
144
-
145
-
146
-
147
-
148
-
149
-
150
-
151
-
152
-
153
-
154
-
155
-
156
-
157
-
158
-
159
-
160
-
161
-
162
-
163
-
164
-
165
-
166
-
167
-
168
-
169
-
170
-
171
-
172
-
173
-
174
-
175
-
176
-
177
-
178
-
179
-
180
-
181
-
182
-
183
-
184
-
185
-
186
-
187
-
188
-
189
-
190
-
191
-
192
-
193
-
194
-
195
-
196
-
197
-
198
-
199
-
200
-
201
-
202
-
203
-
204
-
205
-
206
-
207
-
208
-
209
-
210
-
211
-
212
-
213
-
214
-
215
-
216
-
217
-
218
-
219
-
220
-
221
-
222
-
223
-
224
-
225
-
226
-
227
-
228
-
229
-
230
-
231
-
232
-
233
-
234
-
235
-
236
-
237
-
238
-
239
-
240
-
241
-
242
-
243
-
244
-
245
-
246
-
247
-
248
-
249
-
250
-
251
-
252
-
253
-
254
-
255
-
256
-
257
-
258
-
259
-
260
-
261
-
262
-
263
-
264
-
265
-
266
-
267
-
268
-
269
-
270
-
271
-
272
-
273
-
274
 |
 |

| 11 >MANAGEMENT REPORT
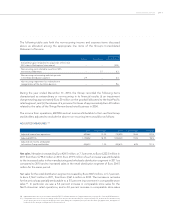
The following table sets forth the non-recurring income and expense items discussed
above as allocated among the appropriate line items of the Group’s Consolidated
Statement of Income:
Selling Advertising
General and
administrative
Extraordinary gain related to the acquisition of the initial
40% stake in Multiopticas Internacional – – (19.0)
Non-recurring costs related to Luxottica’s 50th
anniversary celebrations – 5.7 6.3
Non-recurring restructuring and start-up costs
in the Retail distribution segment 2.9 – 8.3
Non-recurring impairment loss related to the
reorganization of the Australian business – – 9.6
During the year ended December 31, 2010, the Group recorded the following items
characterized as extraordinary or non-recurring in its financial results: (i) an impairment
charge totaling approximately Euro 20 million on the goodwill allocated to the Asia-Pacific
retail segment, and (ii) the release of a provision for taxes of approximately Euro 20 million
related to the sales of the Things Remembered retail business in 2006.
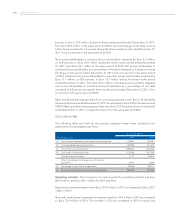
The income from operations, EBITDA and net income attributable to the Luxottica Group
stockholders adjusted to exclude the above non-recurring items would be as follows:
ADJUSTED MEASURES (10)
2011 % of net sales 2010 % of net sales % change
Adjusted income from operations 820,863 13.2% 732,590 12.6% 12.0%
Adjusted EBITDA 1,135,852 18.3% 1,034,220 17.8% 9.8%
Adjusted net income attributable
to Luxottica Group stockholders 455,613 7.3% 402,675 6.9% 13.1%
Net sales. Net sales increased by Euro 424.5 million, or 7.3 percent, to Euro 6,222.5 million in
2011 from Euro 5,798.0 million in 2010. Euro 219.9 million of such increase was attributable
to the increased sales in the manufacturing and wholesale distribution segment in 2011 as
compared to 2010 and to increased sales in the retail distribution segment of Euro 204.5
million for the same period.
Net sales for the retail distribution segment increased by Euro 204.5 million, or 5.7 percent,
to Euro 3,766.1 million in 2011, from Euro 3,561.6 million in 2010. The increase in net sales
for the period was partially attributable to a 5.5 percent improvement in comparable store
sales (11). In particular, we saw a 5.4 percent increase in comparable store sales for the
North American retail operations, and a 4.0 percent increase in comparable store sales
(10) Adjusted measures are not in accordance with IAS/IFRS. For a further discussion of adjusted measures, see page 43 – “Non-IAS/IFRS Measures”.
(11) Comparable store sales re ects the change in sales from one period to another that, for comparison purposes, includes in the calculation only
stores open in the more recent period that also were open during the comparable prior period in the same geographic area, and applies to
both periods the average exchange rate for the prior period.