LensCrafters 2011 Annual Report Download - page 74
Download and view the complete annual report
Please find page 74 of the 2011 LensCrafters annual report below. You can navigate through the pages in the report by either clicking on the pages listed below, or by using the keyword search tool below to find specific information within the annual report.-
 1
1 -
2
-
3
-
4
-
5
-
6
-
7
-
8
-
9
-
10
-
11
-
12
-
13
-
14
-
15
-
16
-
17
-
18
-
19
-
20
-
21
-
22
-
23
-
24
-
25
-
26
-
27
-
28
-
29
-
30
-
31
-
32
-
33
-
34
-
35
-
36
-
37
-
38
-
39
-
40
-
41
-
42
-
43
-
44
-
45
-
46
-
47
-
48
-
49
-
50
-
51
-
52
-
53
-
54
-
55
-
56
-
57
-
58
-
59
-
60
-
61
-
62
-
63
-
 64
64 -
 65
65 -
 66
66 -
 67
67 -
 68
68 -
 69
69 -
 70
70 -
 71
71 -
 72
72 -
 73
73 -
 74
74 -
 75
75 -
 76
76 -
 77
77 -
 78
78 -
 79
79 -
 80
80 -
 81
81 -
 82
82 -
 83
83 -
 84
84 -
85
-
86
-
87
-
88
-
89
-
90
-
91
-
92
-
93
-
94
-
95
-
96
-
97
-
98
-
99
-
100
-
101
-
102
-
103
-
104
-
105
-
106
-
107
-
108
-
109
-
110
-
111
-
112
-
113
-
114
-
115
-
116
-
117
-
118
-
119
-
120
-
121
-
122
-
123
-
124
-
125
-
126
-
127
-
128
-
129
-
130
-
131
-
132
-
133
-
134
-
135
-
136
-
137
-
138
-
139
-
140
-
141
-
142
-
143
-
144
-
145
-
146
-
147
-
148
-
149
-
150
-
151
-
152
-
153
-
154
-
155
-
156
-
157
-
158
-
159
-
160
-
161
-
162
-
163
-
164
-
165
-
166
-
167
-
168
-
169
-
170
-
171
-
172
-
173
-
174
-
175
-
176
-
177
-
178
-
179
-
180
-
181
-
182
-
183
-
184
-
185
-
186
-
187
-
188
-
189
-
190
-
191
-
192
-
193
-
194
-
195
-
196
-
197
-
198
-
199
-
200
-
201
-
202
-
203
-
204
-
205
-
206
-
207
-
208
-
209
-
210
-
211
-
212
-
213
-
214
-
215
-
216
-
217
-
218
-
219
-
220
-
221
-
222
-
223
-
224
-
225
-
226
-
227
-
228
-
229
-
230
-
231
-
232
-
233
-
234
-
235
-
236
-
237
-
238
-
239
-
240
-
241
-
242
-
243
-
244
-
245
-
246
-
247
-
248
-
249
-
250
-
251
-
252
-
253
-
254
-
255
-
256
-
257
-
258
-
259
-
260
-
261
-
262
-
263
-
264
-
265
-
266
-
267
-
268
-
269
-
270
-
271
-
272
-
273
-
274
 |
 |

74 ANNUAL REVIEW 2011
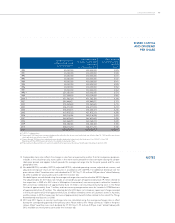
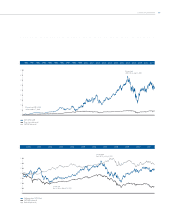
1990–2011
LUXOTTICA SHARE
PERFORMANCE
LUXOTTICA NYSE (US$)
Year Low High Average Closing Year change Average volumes
1990 (a) 0.794 1.456 1.089 1.019 7.24% (b) 989,578
1991 0.988 2.750 1.822 2.750 169.93% 390,719
1992 2.250 3.281 2.852 2.513 –8.64% 313,051
1993 2.025 2.950 2.373 2.925 16.42% 231,107
1994 2.787 3.625 3.279 3.413 16.67% 189,325
1995 3.175 5.950 4.180 5.850 71.43% 417,048
1996 5.212 8.100 7.033 5.213 –10.90% 348,201
1997 5.125 6.988 6.092 6.250 19.90% 427,059
1998 3.875 9.494 6.964 6.000 –4.00% 342,659
1999 5.000 10.313 7.613 8.781 46.36% 354,464
2000 7.969 17.000 12.945 13.750 56.58% 222,136
2001 12.150 17.990 15.283 16.480 19.85% 248,020
2002 11.820 20.850 16.184 13.650 –17.17% 273,378
2003 10.230 18.150 13.877 17.400 27.47% 156,275
2004 15.180 20.390 17.344 20.390 17.18% 80,921
2005 19.690 25.830 22.408 25.310 24.13% 70,244
2006 24.360 31.390 28.303 30.670 21.18% 76,514
2007 29.700 39.380 33.699 31.490 2.67% 125,672
2008 15.980 30.920 24.228 18.120 –42.46% 251,319
2009 11.880 26.910 20.991 25.680 41.72% 145,041
2010 22.590 30.620 26.502 30.620 19.24% 88,537
2011 25.070 34.400 29.991 27.930 –8.76% 86,878
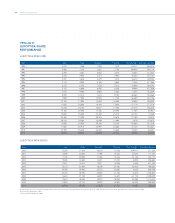
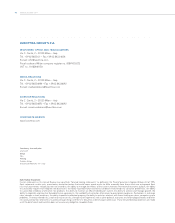
LUXOTTICA MTA (EURO)
Year Low High Average Closing Year change Average volumes
2000 (a) 15.239 17.618 16.530 15.356 16.99% (c) 211,328
2001 13.409 20.620 17.096 18.430 20.02% 117,744
2002 11.750 22.950 17.380 12.576 –31.76% 204,110
2003 9.248 14.820 12.231 13.700 8.94% 458,682
2004 12.427 15.512 13.911 14.995 9.45% 671,783
2005 15.110 21.940 18.109 21.430 42.91% 789,552
2006 19.300 24.460 22.512 23.280 8.63% 869,788
2007 22.720 28.790 24.640 21.750 –6.57% 1,306,403
2008 12.670 21.150 16.493 12.670 –41.75% 2,058,049
2009 9.610 18.250 14.910 18.050 42.46% 1,110,437
2010 17.820 23.170 19.974 22.800 26.32% 938,423
2011 18.730 23.490 21.529 21.700 –4.82% 783,864
(a) Amounts have been retroactively adjusted to re ect the ve-for-one stock split which was effective April 16, 1998, and the two-for-one stock split which was effective June 26, 2000.
(b) From IPO (January 24, 1990).
(c) From IPO (December 4, 2000).