LensCrafters 2006 Annual Report Download - page 95
Download and view the complete annual report
Please find page 95 of the 2006 LensCrafters annual report below. You can navigate through the pages in the report by either clicking on the pages listed below, or by using the keyword search tool below to find specific information within the annual report.-
 1
1 -
2
-
3
-
4
-
5
-
6
-
7
-
8
-
9
-
10
-
11
-
12
-
13
-
14
-
15
-
16
-
17
-
18
-
19
-
20
-
21
-
22
-
23
-
24
-
25
-
26
-
27
-
28
-
29
-
30
-
31
-
32
-
33
-
34
-
35
-
36
-
37
-
38
-
39
-
40
-
41
-
42
-
43
-
44
-
45
-
46
-
47
-
48
-
49
-
50
-
51
-
52
-
53
-
54
-
55
-
56
-
57
-
58
-
59
-
60
-
61
-
62
-
63
-
64
-
65
-
66
-
67
-
68
-
69
-
70
-
71
-
72
-
73
-
74
-
75
-
76
-
77
-
78
-
79
-
80
-
81
-
82
-
83
-
84
-
 85
85 -
 86
86 -
 87
87 -
 88
88 -
 89
89 -
 90
90 -
 91
91 -
 92
92 -
 93
93 -
 94
94 -
 95
95 -
 96
96 -
 97
97 -
 98
98 -
 99
99 -
 100
100 -
 101
101 -
 102
102 -
 103
103 -
 104
104 -
 105
105 -
106
-
107
-
108
-
109
-
110
-
111
-
112
-
113
-
114
-
115
-
116
-
117
-
118
-
119
-
120
-
121
-
122
-
123
-
124
-
125
-
126
-
127
-
128
-
129
-
130
-
131
-
132
-
133
-
134
-
135
-
136
-
137
-
138
-
139
-
140
-
141
-
142
-
143
-
144
-
145
-
146
-
147
-
148
-
149
-
150
-
151
-
152
-
153
-
154
-
155
-
156
-
157
-
158
-
159
-
160
-
161
-
162
-
163
-
164
-
165
-
166
 |
 |
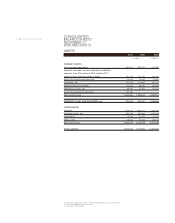
LUXOTTICA GROUP
SHARE CAPITAL INFORMATION |95 <
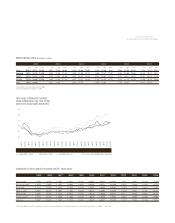
MTA Ordinary share (Quarterly - In Euro)
2006 2005 2004 2003 2002 2001
Low High Close Low High Close Low High Close Low High Close Low High Close Low High Close
First 20.37 24.12 22.74 15.11 17.02 15.83 12.42 14.08 12.80 9.25 13.48 9.81 18.34 22.95 22.43 7.20 14.37 16.80
Second 19.30 24.19 21.22 15.31 17.55 17.13 12.82 13.99 13.70 9.85 12.37 11.92 18.54 22.88 19.69 15.04 19.11 19.11
Third 20.15 23.25 23.23 17.21 21.00 20.69 13.31 14.54 14.42 11.67 13.96 12.23 11.75 19.05 13.22 13.41 20.62 15.74
Fourth 22.53 24.46 23.28 19.62 21.94 21.43 14.31 15.51 14.99 12.35 14.82 13.70 12.00 15.52 12.58 14.88 19.59 18.43
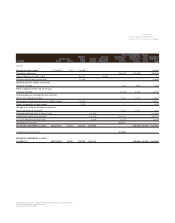
Year 19.30 24.46 15.11 21.94 12.42 15.51 9.25 14.82 11.75 22.95 13.41 20.62
Six-year high: Euro 24.46 on November 8, 2006.
Six-year low: Euro 9.25 on March 12, 2003.
AVERAGE EURO/US$ EXCHANGE RATE: 1995-2006
1995(1) 1996(1) 1997 (1) 1998(1) 1999 2000 2001 2002 2003 2004 2005 2006
First quarter 1.1793 1.2307 1.1823 1.0802 1.1207 0.9859 0.9230 0.8766 1.0731 1.2497 1.3113 1.2023
Second quarter 1.1613 1.2443 1.1457 1.0944 1.0567 0.9326 0.8721 0.9198 1.1372 1.2046 1.2594 1.2579
Six-month 1.1711 1.2376 1.1634 1.0873 1.0873 0.9591 0.8990 0.8980 1.1049 1.2273 1.2847 1.2292
Third quarter 1.2081 1.2727 1.0991 1.1130 1.0483 0.9041 0.8895 0.9838 1.1248 1.2220 1.2197 1.2743
Nine-month 1.1816 1.2493 1.1405 1.0961 1.0737 0.9400 0.8956 0.9277 1.1117 1.2255 1.2627 1.2444
Fourth quarter 1.2160 1.2721 1.1255 1.1765 1.0370 0.8676 0.8959 0.9982 1.1882 1.2968 1.1886 1.2889
Full year 1.1887 1.2549 1.1367 1.1152 1.0642 0.9209 0.8957 0.9450 1.1307 1.2435 1.2444 1.2553
(1) Through 1998 the Euro/US$ exchange rate has been calculated through the Lira/US$ exchange rate, converted by the fixed rate Lire 1,936.27 = Euro 1.00.
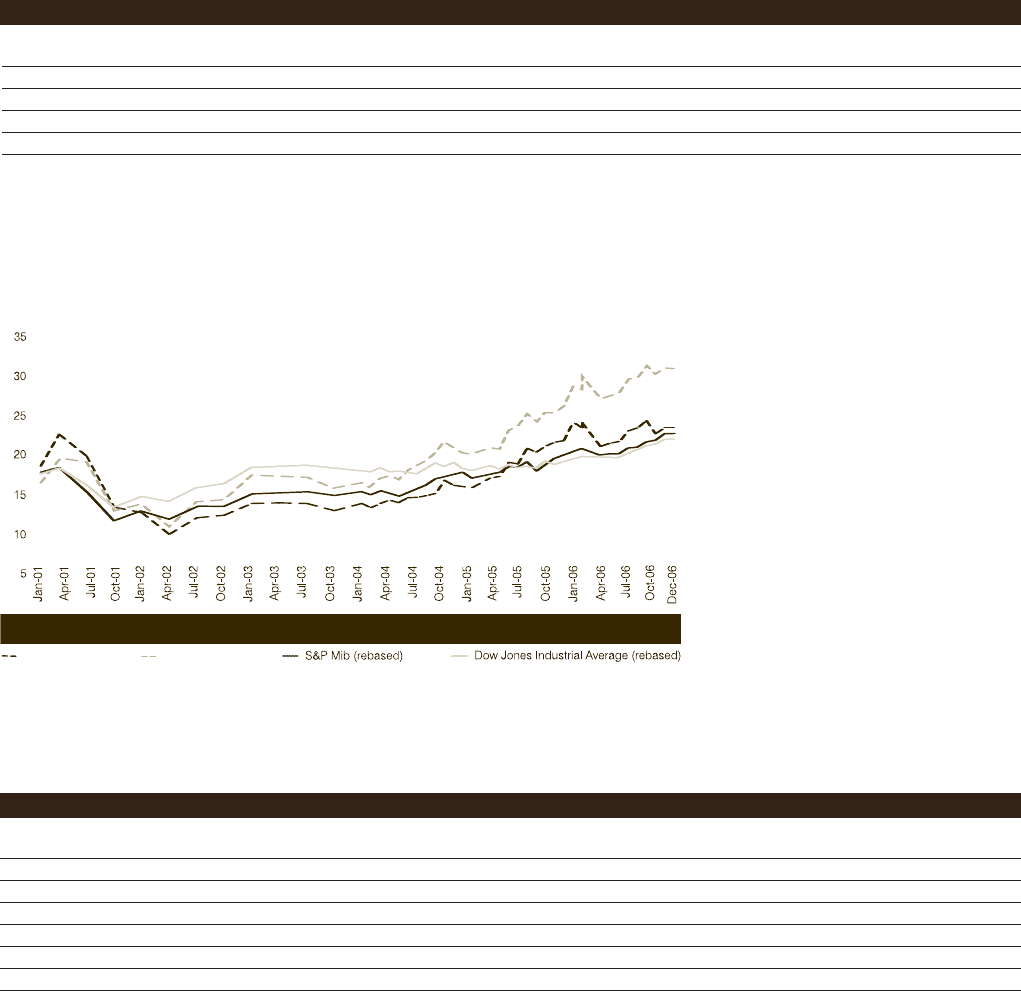
Share (MTA - Euro) ADS (NYSE - US$)
ADS AND ORDINARY SHARE
PERFORMANCE ON THE NYSE
AND MTA AND MAIN INDEXES