LensCrafters 2006 Annual Report Download - page 101
Download and view the complete annual report
Please find page 101 of the 2006 LensCrafters annual report below. You can navigate through the pages in the report by either clicking on the pages listed below, or by using the keyword search tool below to find specific information within the annual report.-
 1
1 -
2
-
3
-
4
-
5
-
6
-
7
-
8
-
9
-
10
-
11
-
12
-
13
-
14
-
15
-
16
-
17
-
18
-
19
-
20
-
21
-
22
-
23
-
24
-
25
-
26
-
27
-
28
-
29
-
30
-
31
-
32
-
33
-
34
-
35
-
36
-
37
-
38
-
39
-
40
-
41
-
42
-
43
-
44
-
45
-
46
-
47
-
48
-
49
-
50
-
51
-
52
-
53
-
54
-
55
-
56
-
57
-
58
-
59
-
60
-
61
-
62
-
63
-
64
-
65
-
66
-
67
-
68
-
69
-
70
-
71
-
72
-
73
-
74
-
75
-
76
-
77
-
78
-
79
-
80
-
81
-
82
-
83
-
84
-
85
-
86
-
87
-
88
-
89
-
90
-
 91
91 -
 92
92 -
 93
93 -
 94
94 -
 95
95 -
 96
96 -
 97
97 -
 98
98 -
 99
99 -
 100
100 -
 101
101 -
 102
102 -
 103
103 -
 104
104 -
 105
105 -
 106
106 -
 107
107 -
 108
108 -
 109
109 -
 110
110 -
 111
111 -
112
-
113
-
114
-
115
-
116
-
117
-
118
-
119
-
120
-
121
-
122
-
123
-
124
-
125
-
126
-
127
-
128
-
129
-
130
-
131
-
132
-
133
-
134
-
135
-
136
-
137
-
138
-
139
-
140
-
141
-
142
-
143
-
144
-
145
-
146
-
147
-
148
-
149
-
150
-
151
-
152
-
153
-
154
-
155
-
156
-
157
-
158
-
159
-
160
-
161
-
162
-
163
-
164
-
165
-
166
 |
 |

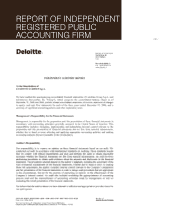
REPORT OF
INDEPENDENT REGISTERED
PUBLIC ACCOUNTING FIRM |101 <
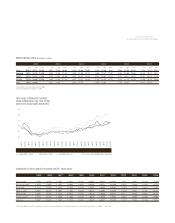
2004 2005 2006 2006
(Euro/000) (US $/000) (1)
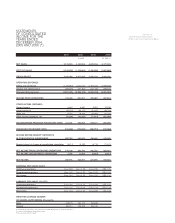
NET SALES 3,179,613 4,134,263 4,676,156 6,171,123
COST OF SALES (1,018,633) (1,316,664) (1,426,000) (1,881,892)
GROSS PROFIT 2,160,980 2,817,598 3,250,156 4,289,230
OPERATING EXPENSES
Selling and advertising (1,342,982) (1,774,241) (1,967,034) (2,595,895)
General and administrative (338,499) (461,957) (527,135) (695,660)
Total operating expenses (1,681,481) (2,236,198) (2,494,169) (3,291,555)
INCOME FROM OPERATIONS 479,499 581,401 755,987 997,676
OTHER INCOME (EXPENSE)
Interest income 6,662 5,650 9,804 12,938
Interest expense (55,378) (66,171) (70,622) (93,200)
Other,net 13,792 18,429 (16,992) (22,424)
Other income (expense), net (34,924) (42,092) (77,810) (102,686)
INCOME BEFORE PROVISION FOR INCOME TAXES 444,575 539,309 678,177 894,990
PROVISION FOR INCOME TAXES (156,852) (199,266) (238,757) (315,088)
INCOME BEFORE MINORITY INTERESTS
IN CONSOLIDATED SUBSIDIARIES 287,723 340,043 439,420 579,902
Minority interests in income of consolidated subsidiaries (8,614) (9,253) (8,715) (11,501)
NET INCOME FROM CONTINUING OPERATIONS 279,109 330,790 430,705 568,401
NET INCOME DISCONTINUED OPERATIONS 7,765 11,504 (6,419) (8,471)
NET INCOME 286,874 342,294 424,286 559,930
EARNINGS PER SHARE: BASIC
Continuing operations Euro 0.62 Euro 0.73 Euro 0.95 US$ 1.25
Discontinued operations Euro 0.02 Euro 0.03 Euro (0.01) US$ (0.01)
Net income Euro 0.64 Euro 0.76 Euro 0.94 US$ 1.24
EARNINGS PER SHARE: DILUTED
Continuing operations Euro 0.62 Euro 0.73 Euro 0.94 US$ 1.24
Discontinued operations Euro 0.02 Euro 0.03 Euro (0.01) US$ (0.01)
Net income Euro 0.64 Euro 0.76 Euro 0.93 US$ 1.23
WEIGHTED AVERAGE NUMBER
OF SHARES OUTSTANDING (thousands)
Basic 448,275 450,179 452,898
Diluited 450,361 453,303 456,186
STATEMENTS
OF CONSOLIDATED
INCOME FOR THE
YEARS ENDED
DECEMBER 2004,
2005 AND 2006 (*)
(1) Translated for convenience at the New York City Noon Buying Rate as determined in Note 1
See notes to Consolidated Financial Statements.
(*) In accordance with U.S. GAAP.